Titan Images 2019

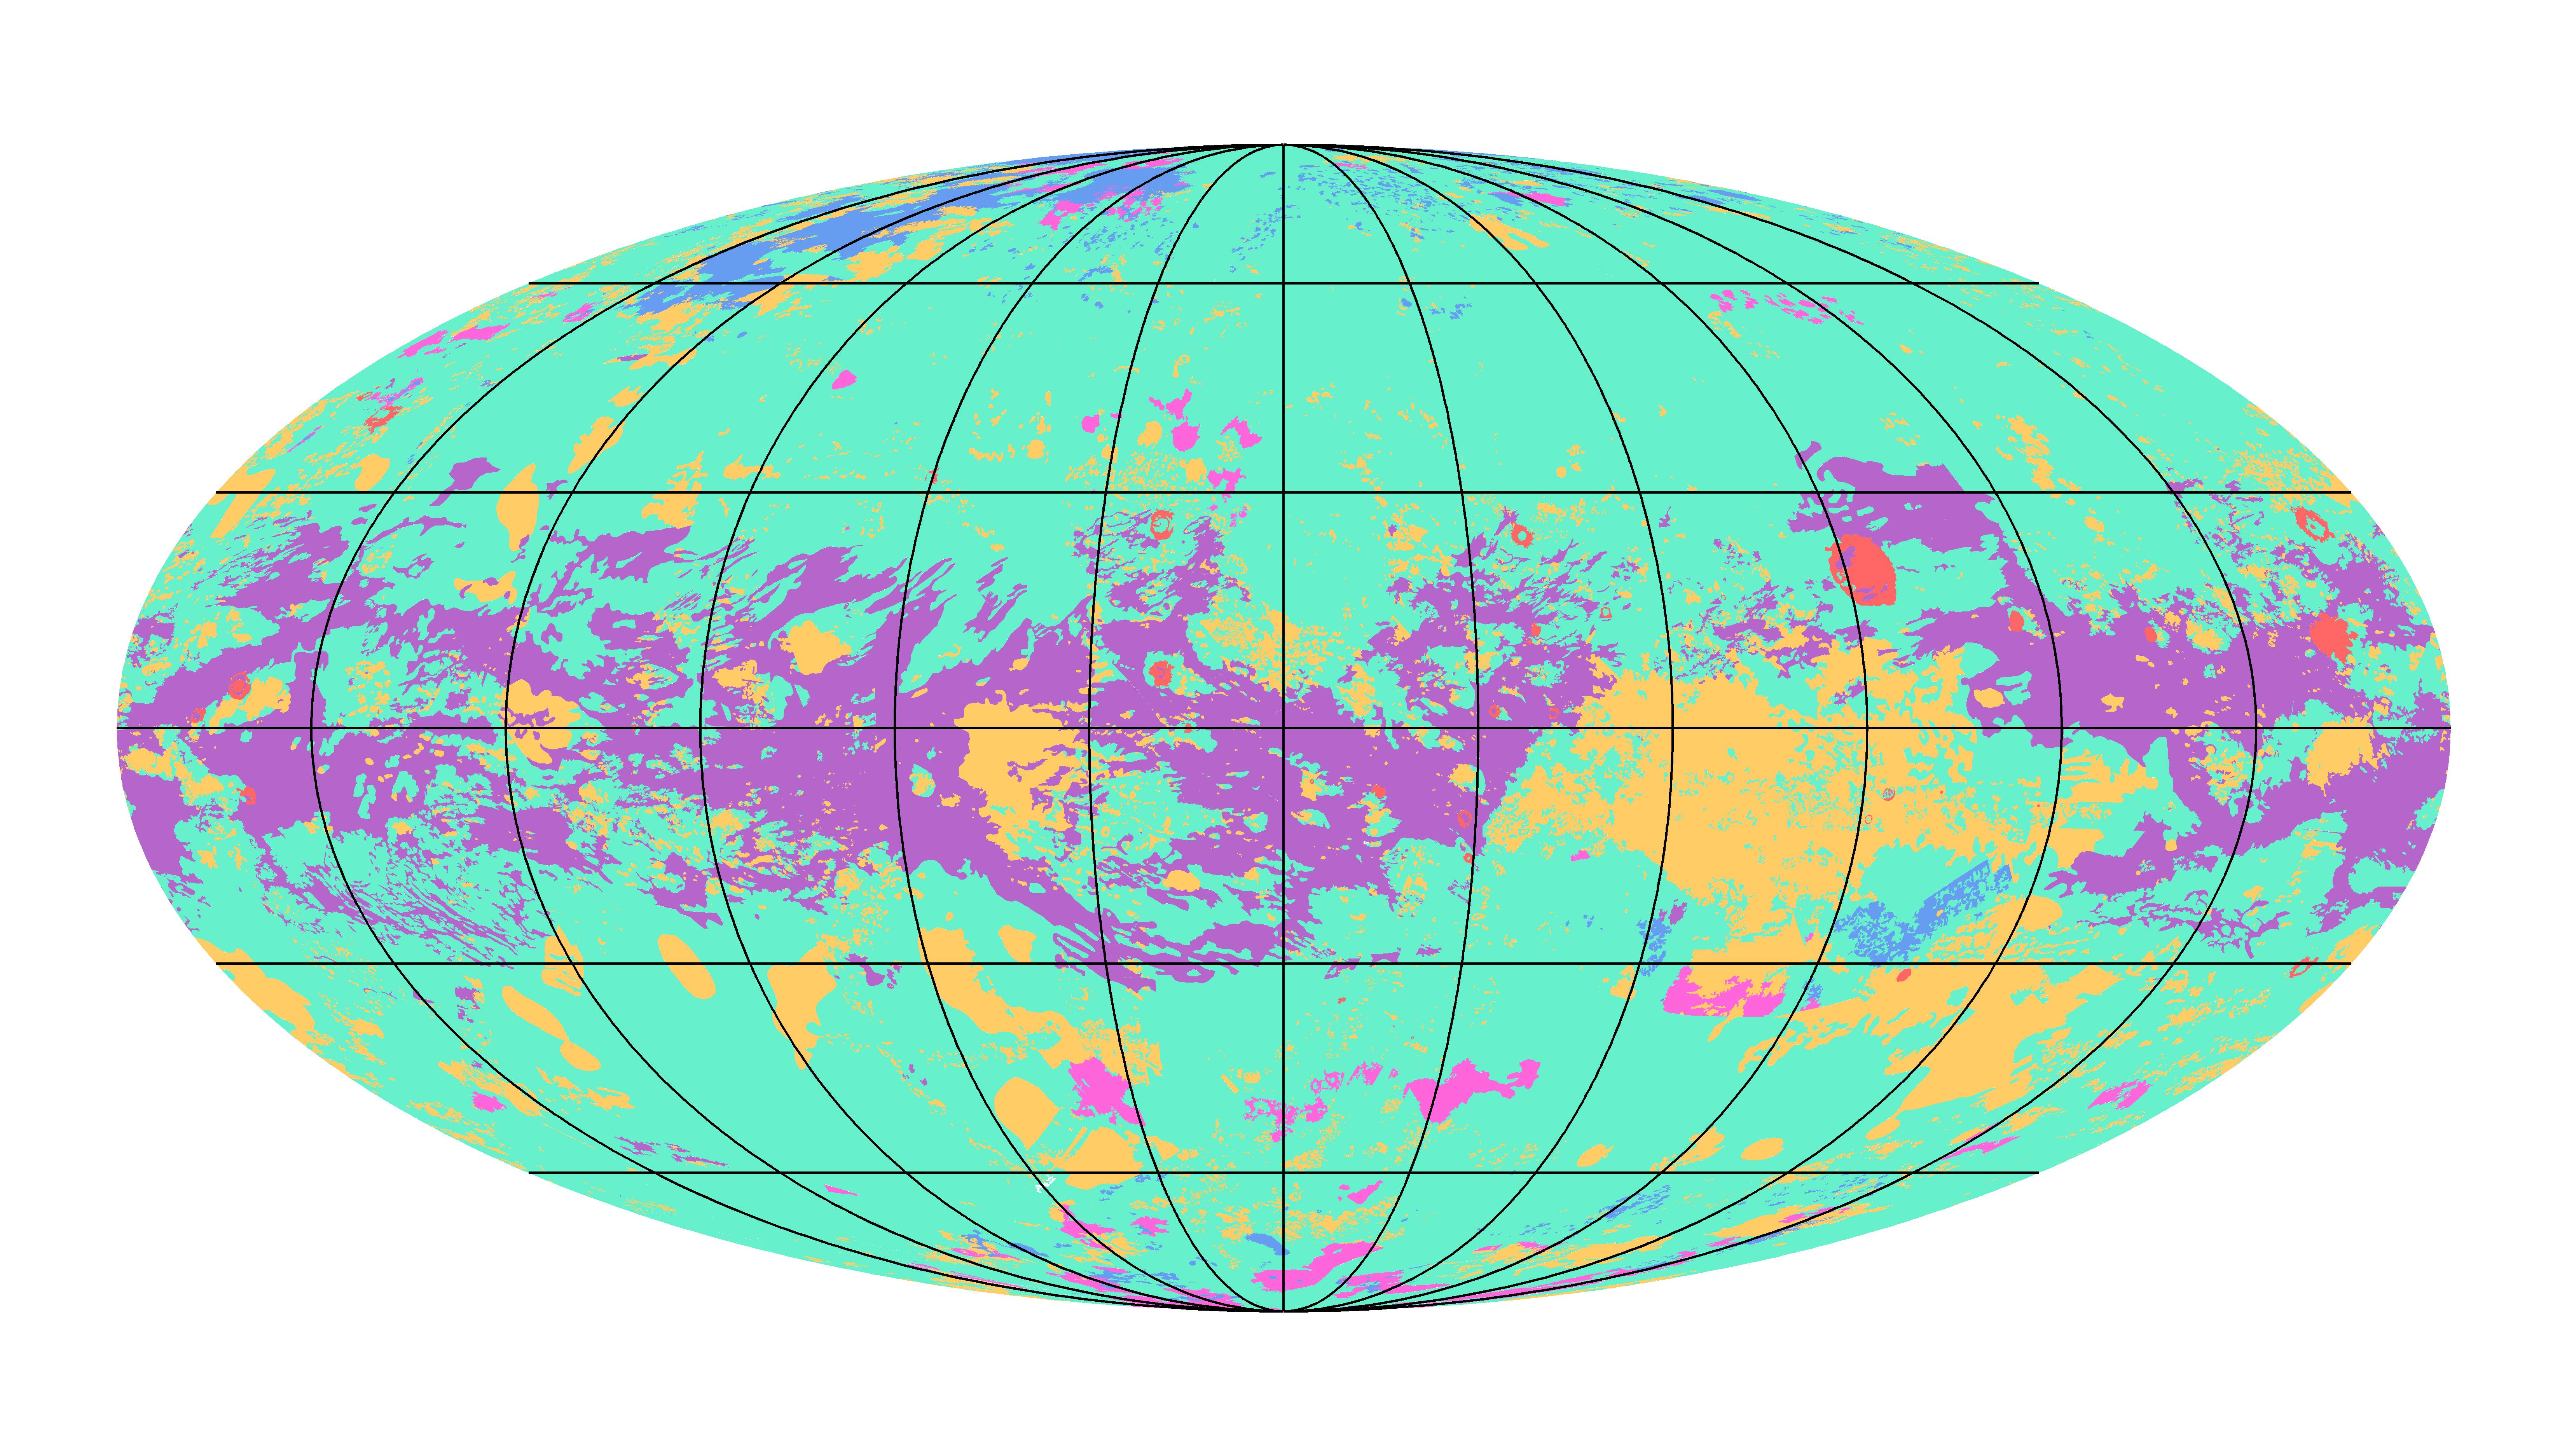
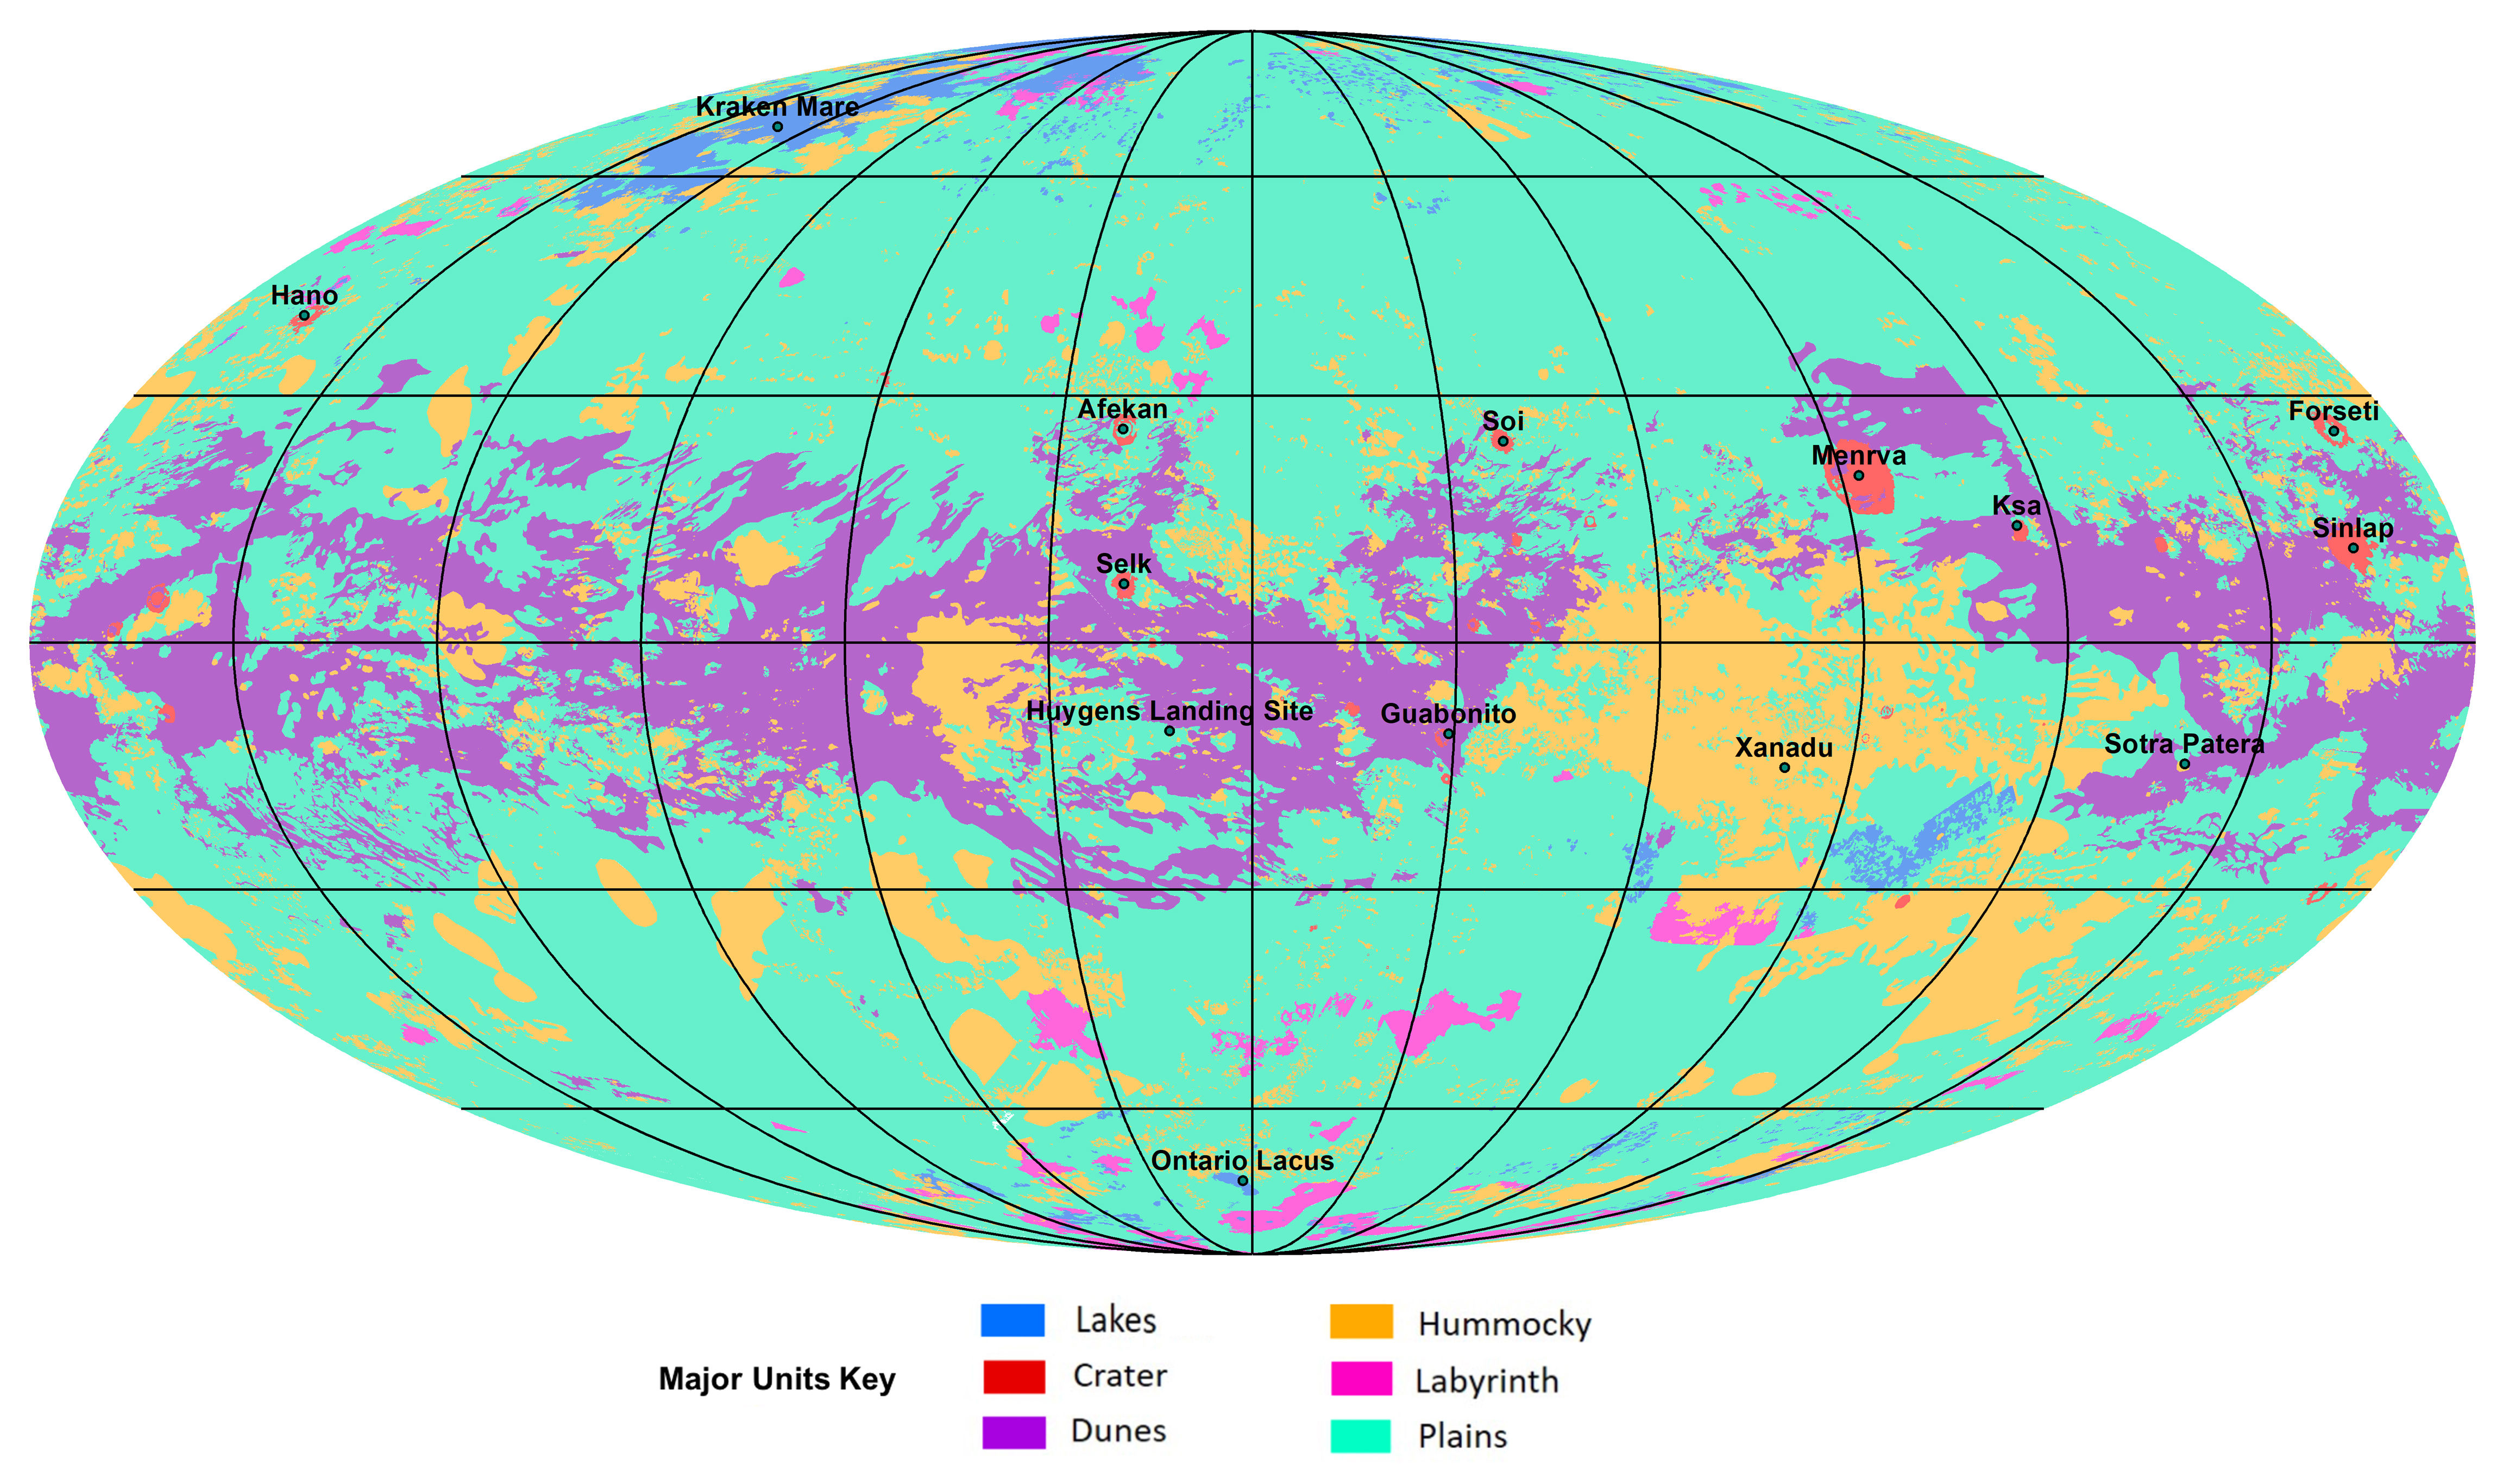
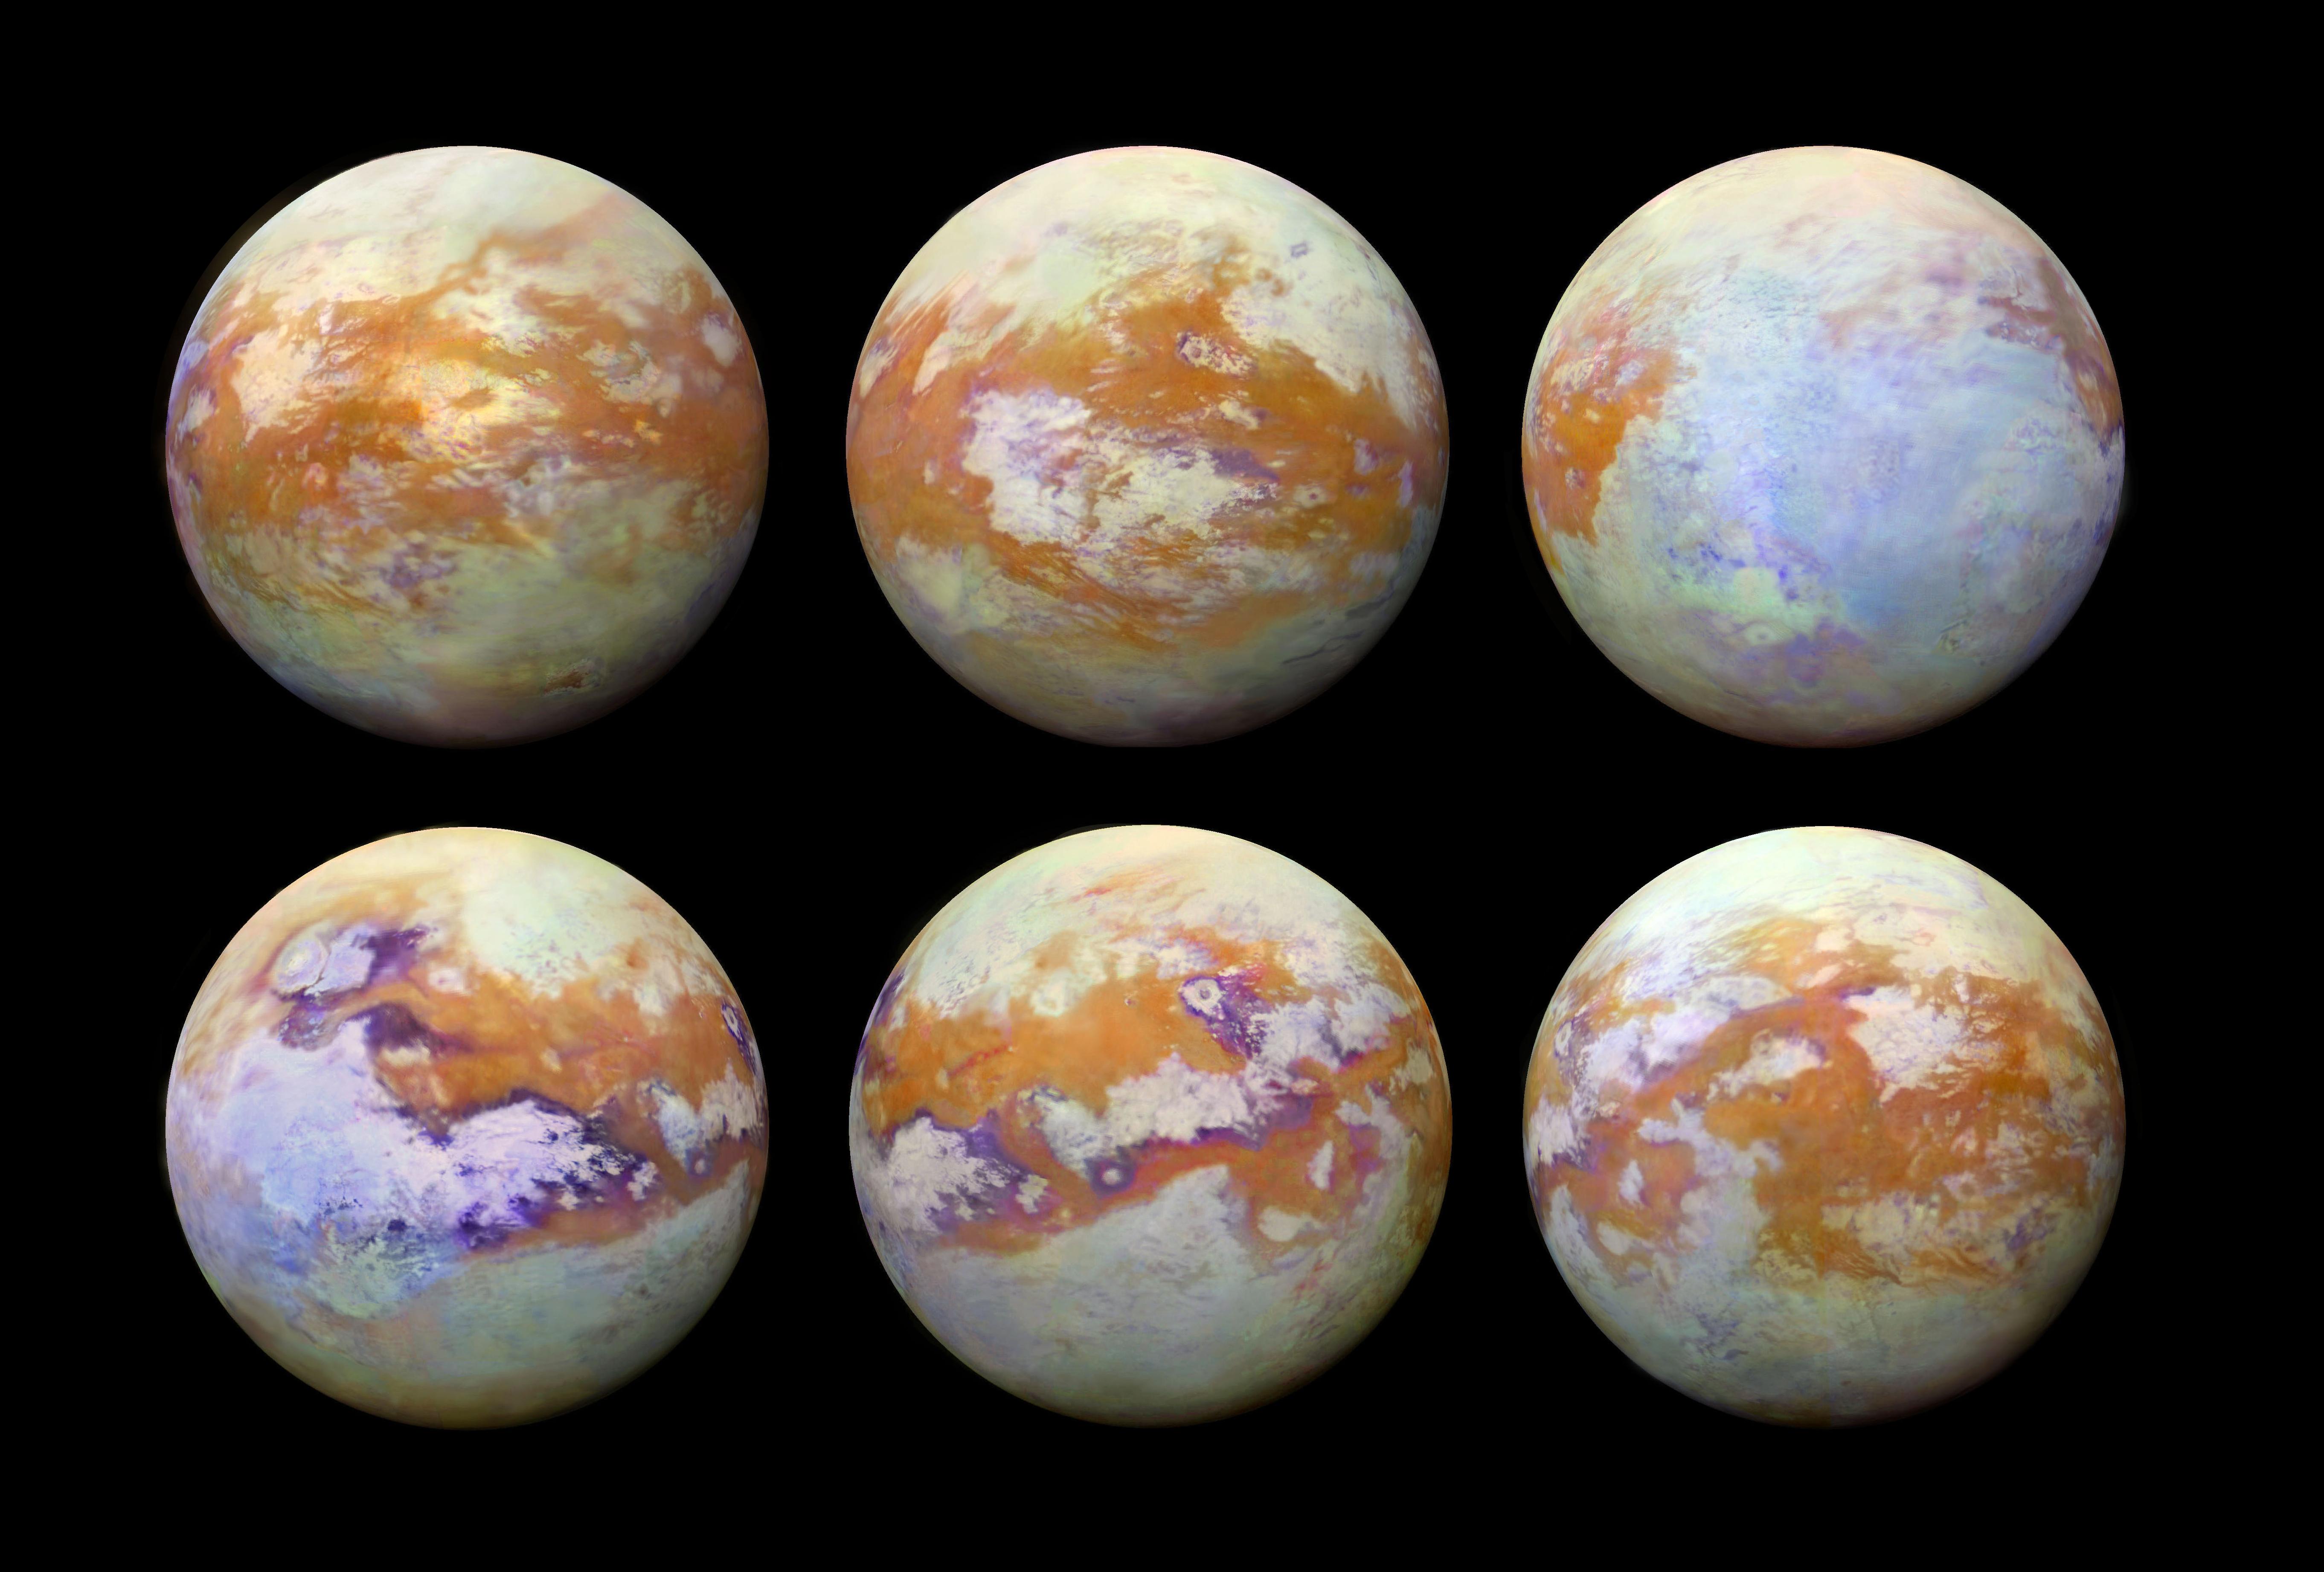
The image in the upper part of this table reveals the first global geologic map of Titan produced on the basis of radar data and Imaging Science Subsystem (ISS) views obtained from the Cassini orbiter during its long mission in the Saturn System from 2004 to 2017. Surface features on Titan can be well identified in the infrared or near-infrared spectrum. The vertical space or the horizontal space between black lines represents 30 degrees of latitude or longitude. The geologic map is in Mollweide projection, an image of the globe that limits the size of area distortion, in particular in the polar areas. Let's note, however, that shapes are increasingly distorted away from the center of the ellipse. The geologic map of the Opaque Moon is centered on 0 degree latitude and 180 degrees longitude. The scale in the global map is 1:20,000,000.
The image in the lower part of the table reveals the same map with the names of the types of terrain and with the names of some key areas like Xanadu or Kraken Mare. One can also notice the landing site of the Huygens probe, proposed by the European Space Agency, at a relatively low latitude. The various types of terrain or surface features are indicated by specific colors. The plains are represented by a light blue. The areas forming a type of labyrinth and which may represent tectonically dirsrupted regions often unveiling drainage channels appear pink. The hummocky terrain, composed of hills or mountains, appears yellow. The areas of dunes, which tend to be linear and parallel like Seif dunes on Earth, unveil a purple color. The lakes, seas or rivers, dominated by methane or ethane, unveil a strong blue. The craters which likely represent impact craters appear red in this global geologic map.

Image Credit: NASA/JPL-Caltech/ASU.


The image above reveals a portion of Titan's surface obtained with the Imaging Science Subsystem of the Cassini spacecraft on October 26, 2004. Surface features can be discerned thanks to the use of near-infrared filters that allow us to see through the deep, thick and opaque atmosphere of Saturn's largest moon. One can notice the remarkable contrast between relatively dark and relatively bright areas as well as surface streaks in the equatorial region. Those streaks tend to be oriented from east to west but some streaks turn toward the north whereas other streaks turn toward the south. The particular orientation of some streaks may be related to topographic factors. We know, today, that the relatively dark areas of the low or mid-latitudes of Titan are dominated by relatively linear and parallel dunes extending over long distances. North appears in the upper part of the view a few degrees to the right. The scale of the image is 0.85 kilometer or 0.53 mile per pixel.

Image Credit: NASA/JPL/Space Science Institute.


The artistic view above shows a type of lake on Titan which may be related to the explosion of a pocket of molecular nitrogen long ago. Some small lakes of the high latitudes of the northern hemisphere of Saturn's largest moon surprisingly unveil steep and elevated rims. That type of topography or morphology may not be related to the typical dissolution processes that we encounter in limestone on Earth. A new theory suggests that those types of small lakes, identified in radar images acquired from the Cassini spacecraft, may have taken shape in craters engendered by explosions of nitrogen beneath the crust due to warming phenomena. Winnipeg Lacus is the perfect example of that type of exotic lake which may be dominated by liquid methane. Over time, the concentration of methane in Titan's atmosphere may vary and the changes in the atmospheric composition may have a significant impact on the stability or dynamics of the lakes and the external crust because methane generates greenhouse effects like carbon dioxide or water vapor on Earth.

Image Credit: NASA/JPL-Caltech.


The image above, revealing the south polar region of Saturn's largest moon Titan, represents a mosaic of images obtained on July 2, 2004 with the Narrow-Angle Camera of the Cassini spacecraft. The Cassini-Huygens probe took the original views at a range of 339,000 kilometers or 210,600 miles from the Opaque Moon. Those views were taken through special filters which allow us to see through the thick haze or through the deep and opaque atmosphere of that enigmatic moon. One can discern surface features as well as numerous clouds close to the south pole in that view. One can notice a significant contrast between relatively bright areas and relatively dark areas. The landscape becomes more blurry toward the limb due to the fact that radiations reflected off the surface at the level of the limb must travel through more air or atmosphere before reaching the camera of the probe. Sinuous, linear or circular patterns can be observed in the mosaic. Thanks to the Cassini-Huygens mission, we know, now, that the south polar region of Titan contains a major pool of liquids known as Ontario Lacus.

Image Credit: NASA/JPL/Space Science Institute.


The image above, obtained during the Cassini mission in the Saturn System which started in 2004 and which ended in 2017, reveals a portion of Titan's atmosphere which appears completely opaque from outer space in the visible spectrum. One can notice, in particular, the detached haze layer evolving in the upper atmosphere of Saturn's largest moon. That thin layer appears purple in this colorized view and the color is close to what the human eye would see from outer space. The original image was acquired with the Narrow-Angle Camera of the Cassini orbiter on July 3, 2004, one day after the first flyby of Titan. The view was captured at a distance of approximately 789,000 kilometers or 491,000 miles from the giant moon and at a Sun-Titan-probe, or phase, angle of 114 degrees. The image was obtained on the basis of a spectral filter sensitive to wavelengths of ultraviolet radiation centered at 338 nanometers.
The detached haze layer had already been identified thanks to data acquired from the famous interplanetary probes Voyager 1 and Voyager 2 at the beginning of the 1980s. The portion of Titan's disk reveals the southern polar region. The artificial colors roughly reflect what our eyes would see from outer space with the global pale orange hue and the blue or purple detached haze layer found in the upper atmosphere. Let's note however that the haze blankets have been brightened for visibility. The detached haze layers can be clearly seen in the ultraviolet spectrum because the small particles they are made of scatter short wavelengths more efficiently than longer wavelengths such as wavelengths of the visible spectrum and wavelengths of the infrared spectrum.
Photochemistry plays a key role in the upper atmosphere where a haze rich in organics or hydrocarbons is engendered under the influence of ultraviolet light from the Sun. A soup of ions, molecules or radicals involving carbon, hydrogen or nitrogen takes shape with many interactions which lead to the development of new molecules. Thus, a haze is generated in that particular environment. The soup begins at an altitude higher than 600 kilometers or 370 miles above the ground. The molecules which are heavy enough tend to go down to lower altitudes to form the main haze. The main haze is opaque enough to prevent us from discerning surface features in the visible spectrum from outer space. The detached haze layer identified from the Cassini orbiter was observed at an altitude of about 500 kilometers or 310 miles which is much higher than the detached haze layer identified from Voyager which was located in an area between 300 kilometers (185 miles) and 350 kilometers (215 miles) above the ground. Thus, the detached haze layer may have migrated upward from Voyager to Cassini or may be related to seasonal factors. There may be variations in haze production or variations in the strength of atmospheric circulation over time during a Titanian year.

Image Credit: NASA/JPL/Space Science Institute.


The mosaic in the upper part of this table, generated on the basis of data obtained from the Huygens probe during its atmospheric plunge performed on January 14, 2005, unveils an aerial view of Titan's surface. One can notice, in particular, a remarkable contrast between a dark plain and brigh hills composed of a network of dark channels. Does the dark plain correspond to an ancient sea ? Does the plain undergo flooding events from time to time ? The dark channels are likely drainage channels or rivers. They may be closely related to meteorology or rainfall events involving liquid methane. The mosaic in the lower part of this table represents a colorized image of the upper view.

Credit for the original view: ESA/NASA/JPL/University of Arizona.
Credit for the colorization of the original view: Marc Lafferre, 2019.


The view above reveals a mosaic of images of Saturn's largest moon Titan in the infrared spectrum. Each disk of the Opaque Moon Titan unveils surface features thanks to the infrared eye of the Cassini spacecraft whose mission in the Saturn System started in 2004 and ended in 2017. The colors of each disk are artificial and are mainly based on data obtained from the Cassini spacecraft and from the Huygens probe during its remarkable atmospheric descent on January 14, 2005. In the visible spectrum, the surface of Titan can't be discerned from outer space due to the hazy atmosphere of the giant moon but in the infrared spectrum, one can clearly see surface features and a major contrast between relatively bright areas and relatively dark areas.
The dark areas in the low latitudes of the Orange Moon, which appear brown here, tend to be dominated by Seif dunes or linear and parallel dunes extending over long distances. The pools of liquids, rich in hydrocarbons, methane or ethane, are found in the high latitudes of the moon. The bluish or purple areas may reveal materials enriched in water ice. The images of Titan's disk are based on the large amount of data acquired with the Visual and Infrared Mapping Spectrometer (VIMS) of the Cassini spacecraft during its long mission in the Saturn System. These color views are based on a multitude of images or data collected from the Cassini orbiter under multiple illumination and viewing conditions. Specialists had to assemble a multitude of images in order to obtain a seamless mosaic and in order to produce a relatively realistic appearance of Titan's surface. The mosaic was first published in July 2018.

Image Credit: NASA/JPL-Caltech/University of Nantes/University of Arizona.


The image appearing in the upper part of this table represents a raw image of Saturn's largest moon Titan obtained on July 2, 2006 from the Cassini orbiter. The file name of the view is W00015711.jpg. The camera of the probe mobilized the CB3 and CL2 filters to acquire the raw image. The view had not been validated and calibrated at the time of the image release. A validated/calibrated view had to be archived with the Planetary Data System of NASA. The image appearing in the lower part of this table represents a colorized view of the upper view. One can notice surface features in the disk of Titan. The contrast between relatively bright areas and relatively dark areas on the Opaque Moon appears well pronounced.

Credit for the original view of Titan: NASA/JPL-Caltech/Space Science Institute.
Credit for the colorization of Titan: Marc Lafferre, 2019.


Titan Images 2018
Titan Images 2017
Titan Images 2016
Titan Images 2015
Titan Images 2014
Titan Images 2013
Titan Images 2012

Titan Images 2011
Titan Images 2010
Titan Images 2009
Titan Images 2008
Titan Images 2007
Titan Images 2006
Titan Images 2005, 2004

Back to main page