Titan Images 2014

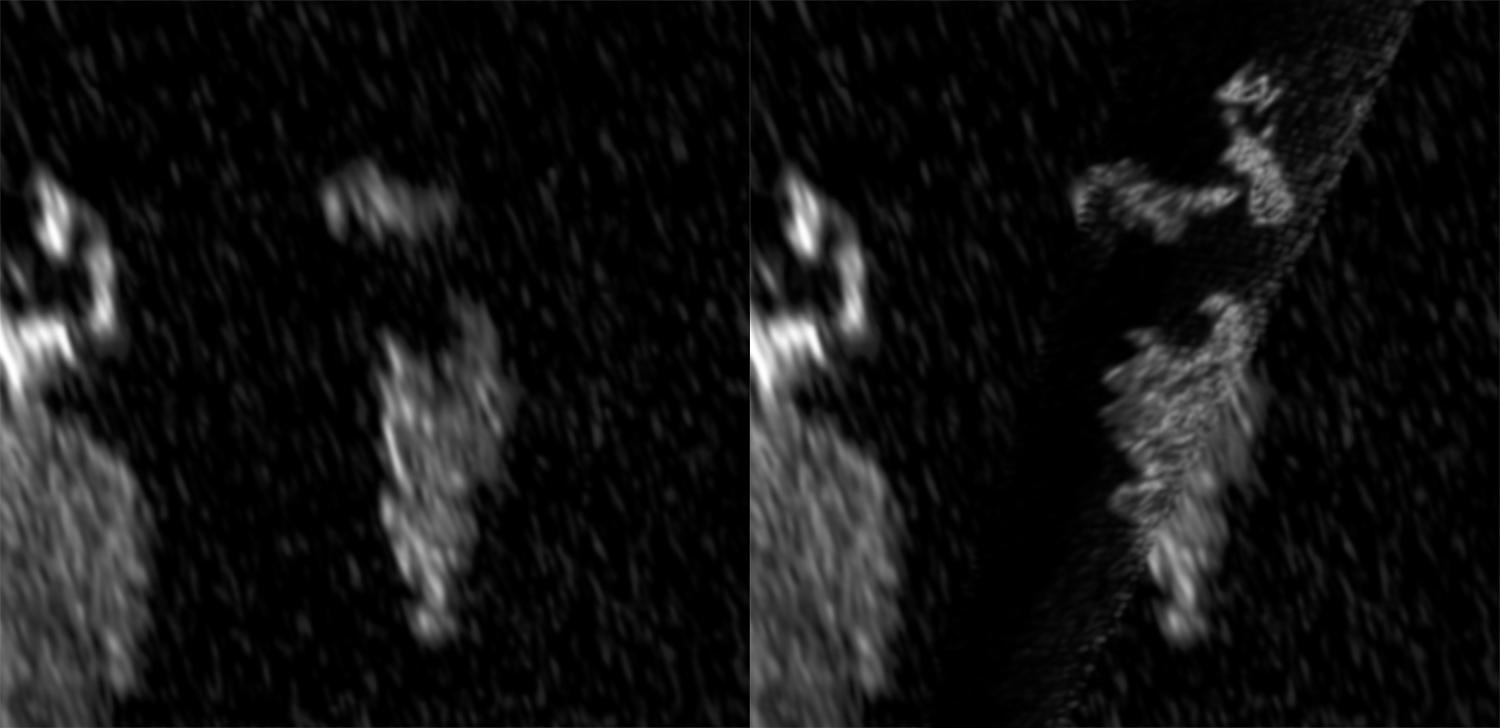
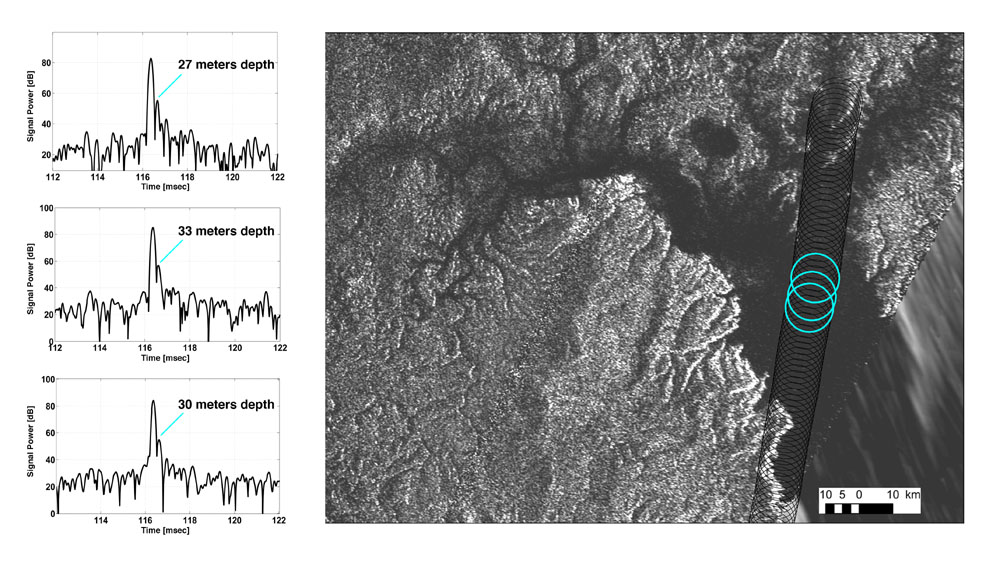
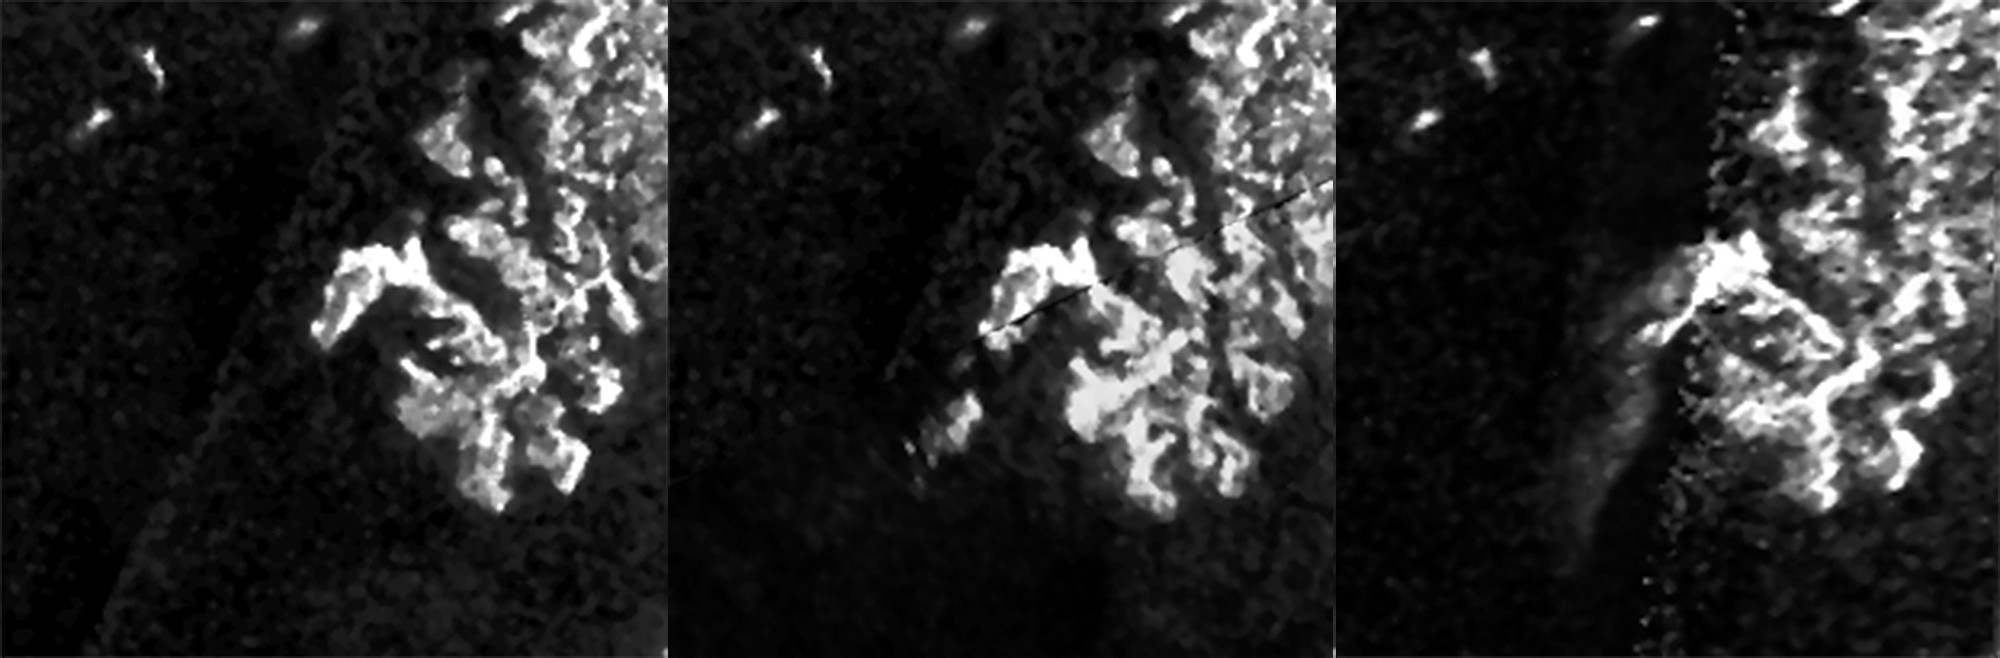
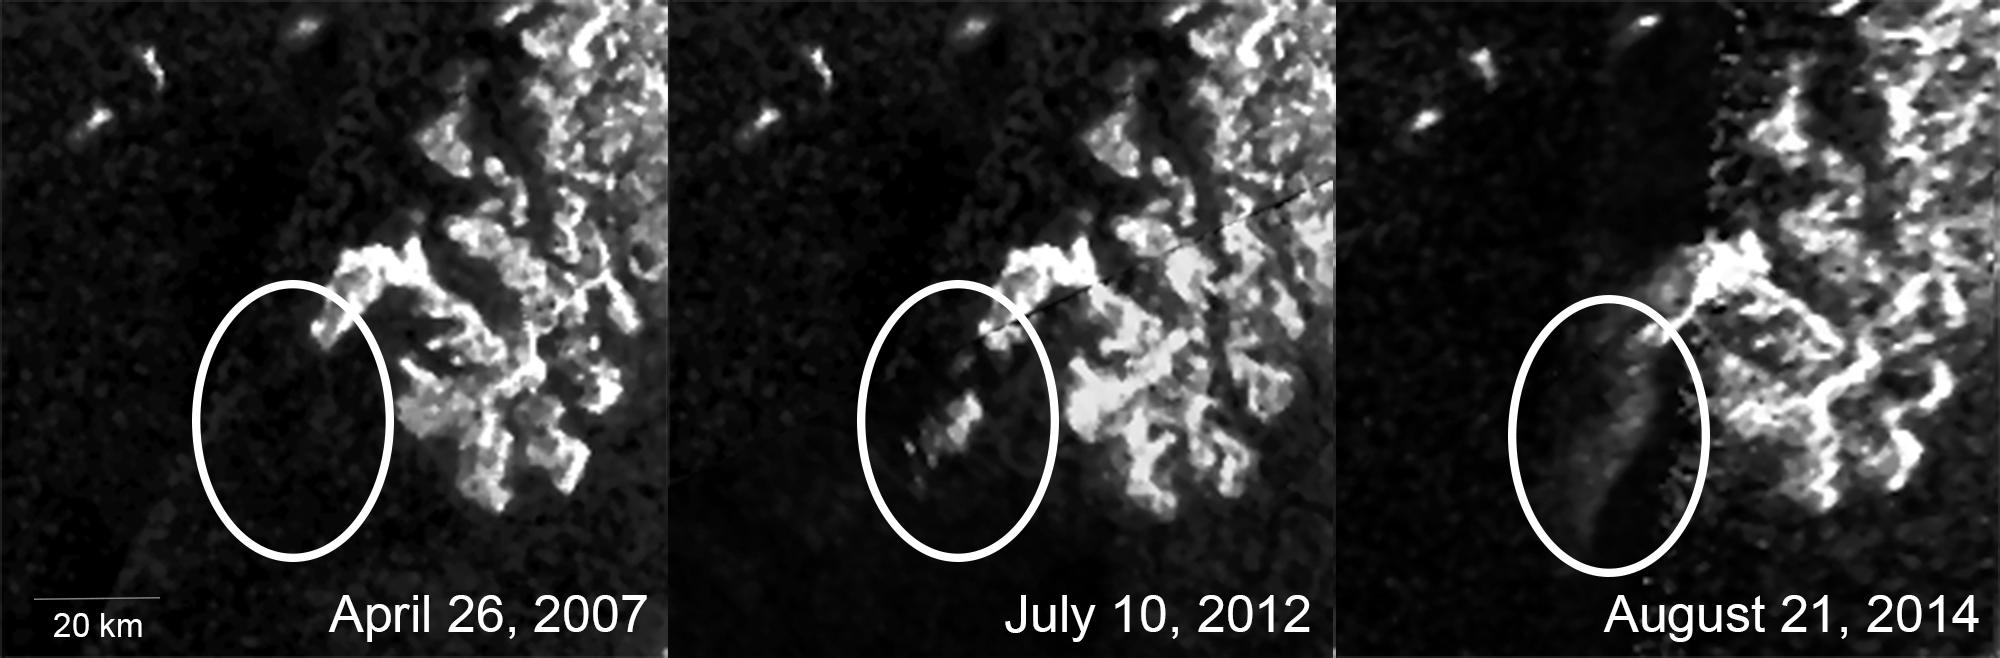
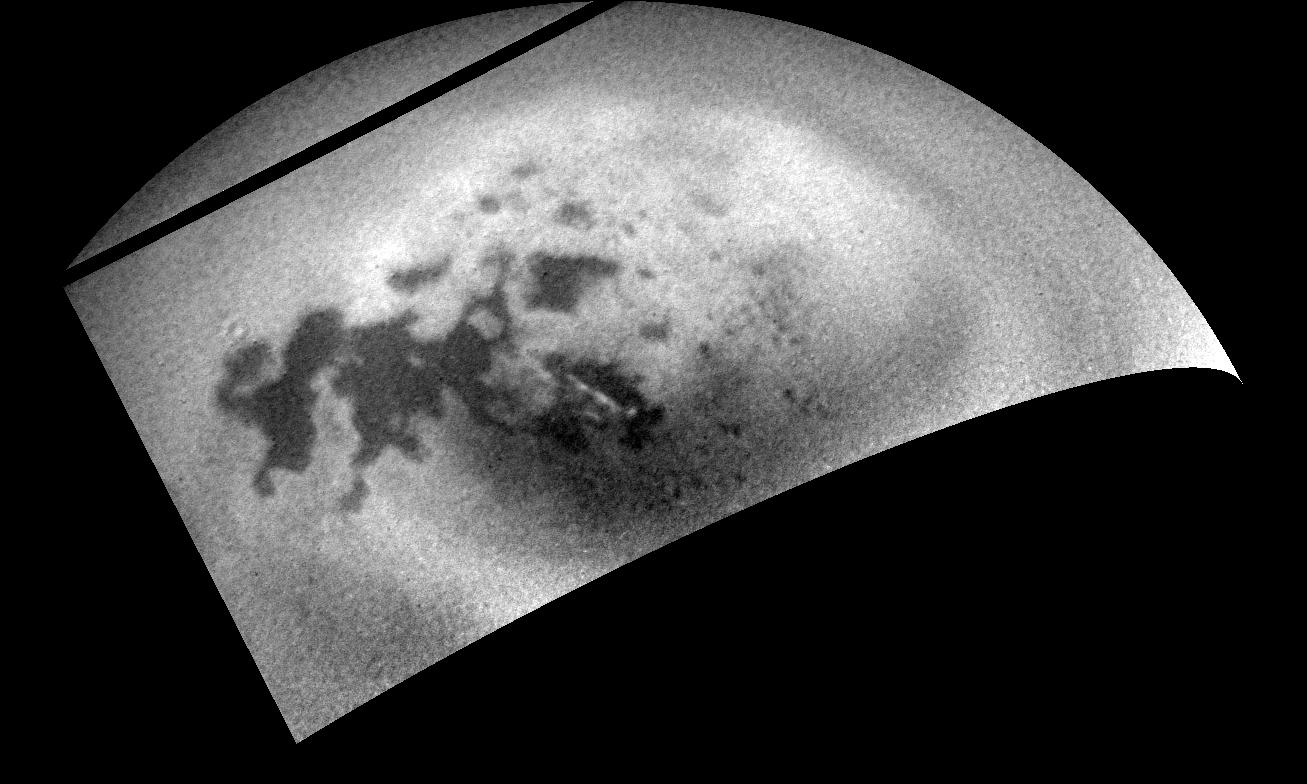
The image in the upper part of the table corresponds to a radar mosaic of a portion of the largest Titanian sea Kraken Mare. The left image and the right image of the mosaic show the same area taken at a different time. The left view was obtained on May 23, 2013 with the Radar Mapper of the Cassini probe and the right image was taken on August 21, 2014 with the same instrument. The Cassini researchers are astonished to discover a new reflective feature in Kraken Mare in the Synthetic Aperture Radar (SAR) image of August 2014. The bright feature, which is relatively big, looks like a new island or archipelago.
A new bright feature dubbed the "Magic Island" had already been identified in the north polar lake or sea Ligeia Mare on the basis of a comparative analysis of radar data between 2013 and 2014. The latest radar image of the intriguing bright feature seems to show that it is spreading or disintegrating. Researchers believe that the bright feature in Kraken Mare is related to something occuring on the sea's surface. The bright feature may be related to waves or floating debris.
The view of May 23, 2013 was acquired from the Radar Mapper at an incidence angle of 56 degrees whereas the view of August 21, 2014 was obtained at an incidence angle of 5 degrees, the incidence angle representing the angle at which the radar signal strikes the surface. The view found in the lower part of the table shows the same region with information upon the date, the location of the new bright feature and the scale.

Image Credit: NASA/JPL-Caltech/ASI/Cornell.


The view in the upper part of the table derives from a radar image obtained with the Radar Mapper of the Cassini probe during the Titan flyby of August 21, 2014. During this flyby, the radar instrument collected altimetry data or height data along a 120-mile or 200-kilometer shore-to-shore track or segment on the largest Titanian sea Kraken Mare. The altimetry data were acquired along the eastern shoreline of the famous sea, in a delta or near the mouth of a wide, flooded river valley.
The radar signal bounced off the sea bottom and back to the probe for a 25-mile or 40-kilometer band of the data unveiling the depth of Kraken Mare in that area. Obviously, the sea is not composed of liquid water due to the harsh environment or the extremely low temperatures. Kraken Mare is likely composed of a mixture of methane and ethane. The researchers managed to determine, on the basis of the observations, that the depths in the studied area range from 66 to 115 feet or 20 to 35 meters.
The radar view shown in the upper part of the table and in the lower part of the table which represents a Synthetic Aperture Radar (SAR) image incorporates successive altimetry observations indicated by black circles. The three blue circles show the locations of the three height or altimetry echoes revealed in the plots found in the lower part of the table on the left part of the image. The radar echoes of the three blue circles show, respectively, depths of 89 feet or 27 meters, 108 feet or 33 meters and 98 feet or 30 meters.
One can notice, in the plots, that the radar or altimetry echoes reveal the typical double-peaked returns of a bottom-reflection, the highest peak corresponding to the sea surface and the shorter peak of the pair representing the sea bottom. The difference in the distance between the two peaks represents the liquid's depth.

Image Credit: NASA/JPL-Caltech/ASI/Cornell.


The image above, obtained in violet light with the Wide-Angle Camera of the Cassini probe on August 11, 2013, reveals an interesting viewing geometry with the giant disk of the Ringed Planet Saturn and its largest moon Titan. The image was taken at a distance of about 1.1 million miles or 1.7 million kilometers from the Gas Giant Saturn and at a Sun-Saturn-probe, or phase, angle of 154 degrees. The camera is orientated toward the illuminated side of the rings from approximately 3 degrees above the ringplane. High-phase observations like this one, where the camera is directed toward the Sun, bring significant scientific clues regarding the composition of the objects or the atmospheres. The way the atmospheres or the rings transmit sunlight will often bring information upon their compositions or physical states. One can notice a crescent of Saturn, the illuminated rings and a crescent of the Opaque Moon Titan which almost encircles its disk due to the presence of a high-altitude haze, in the deep atmosphere, which refracts the solar radiation.

Image Credit: NASA/JPL-Caltech/Space Science Institute.


This near-infrared color view of Titan's atmosphere, taken during the T85 flyby on July 24, 2012, shows a sunglint or a specular reflection off of a relatively small lake called Kivu Lacus close to the north pole of Saturn's largest moon. Kivu Lacus is only approximately 48.2 miles or 77.5 km wide. The mirror-like reflection appeared to be the most intense sunglint that the Cassini probe has acquired to date. We've now imaged several sunglints in the north polar region of Titan. The first sunglint identified occured on July 7, 2009. The most recent clear sunglint took shape in Kraken Mare on August 21, 2014.
It took time for researchers to collect the first sunglint because a specular reflection will only occur in one of the lakes or seas if the Sun  appears above the horizon at the location of the lake or sea and the north polar region encountered the night time during the Winter period until the Northern Spring Equinox which occured in 2009 when the seas or lakes became illuminated by the Sun.
The bright, white patch corresponds to the sunglint off of the lake Kivu Lacus. The pink area surrounding the white dot corresponds to the specular skyglow resulting from the solar illumination of the haze from the specular point on the lake. The faint pink color emanating from just above the sunglint  is likely the outcome of the first waves identified on Titan.
The image was acquired by the Visual and Infrared Mapping Spectrometer instrument of the Cassini spacecraft in the near-infrared spectrum at a distance of 18,600 miles or 30,000 kilometers from the Opaque Moon. In this view, red corresponds to a wavelength of 5.0 microns, green corresponds to 2.8 microns and blue corresponds to 2.0 microns. Therefore, this is not the visible spectrum or the natural color view that the human eye would see.
The human eye would only see an orange haze or an opaque atmosphere and he wouldn't see the sunglint or the specular reflection which would be scattered by the atmospheric haze before reaching the boundaries of the atmosphere. The blue sky observed here is the outcome of scattering off the atmospheric haze which is stronger at shorter or bluer wavelengths. This view has been interpolated from its original 64-by-64 pixel size.

Image Credit: NASA/JPL-Caltech/University of Arizona/University of Idaho.


This image, based on near-infrared data obtained from the Visual and Infrared Mapping Spectrometer of the Cassini probe, corresponds to a color mosaic revealing the north polar area of Saturn's largest moon Titan and showing a spectacular sunglint in the largest pool of liquids Kraken Mare. The image was taken during the T104 flyby of Titan performed by the Cassini probe on August 21, 2014. This is the first time that one can see, at the same time, the region of the north polar seas and lakes and the Sun glinting off of one of the surface bodies of liquids.
The sunglint, corresponding to a specular reflection, can be found in the south of Kraken Mare just north of an island archipelago separating two portions of the sea. The mirror-like reflection which represents a specular point appears in the upper left part of the disk. The image is made of real color data but the human eye wouldn't see those colors due to its particular spectral sensitivities. In other words, this image is not a natural color view of Titan's surface. In this view, red corresponds to 5.0 microns, green to 2.0 microns and blue to 1.3 microns. These wavelengths enable us to see through the opaque atmosphere of the Orange Moon up to the surface. If an astronaut were onboard the Cassini probe, he wouldn't see surface features and he would only see the opaque atmosphere or the haze of Titan.
The sunglint was observed with the highest observation elevation so far and the Sun appeared completely 40 degrees above the horizon as observed from Kraken Mare at that moment which is much higher than the 22 degree-angle in the configuration of PIA18433. The sunglint was particularly powerful or bright so that it saturated the detector of the VIMS instrument and it could be identified through the haze or the atmosphere at much lower wavelengths than in the past, down to 1.3 microns.
The north polar lakes or seas are likely composed of a mixture of methane and ethane. One can notice that the shoreline of the southern portion of Kraken Mare appears bright which suggests that the level of the sea was higher at some point in the past. Strong recent net evaporation processes may account for the apparent decrease in the size of the sea. The bright areas surrounding the sea may in fact correspond to evaporate deposits. There may be some similarities between those deposits and the saline crust on a salt flat.
The region found immediately to the right of the sunglint and corresponding to the highest resolution data from this flyby incorporates the labyrinth of channels that connect Kraken Mare to the second largest body of liquids in the north polar region Ligeia Mare. One can notice that a bright arrow-shaped feature appears in the northern part of Ligeia Mare. This bright feature made up of several patches corresponds, in fact, to clouds of liquid methane droplets. That shows that active meteorological processes may occur in this area with evaporation processes, condensation processes and precipitation processes. The level of the lakes or seas may simply depend on the level of evaporation and rainfall like on our planet.

Image Credit: NASA/JPL-Caltech/Univ. Arizona/Univ. Idaho.


This mosaic shows the disk of Saturn's largest moon Titan and in particular the famous southern polar vortex which was first identified in 2012 from the Cassini probe. The image at left represents a spectral map of the Orange Moon taken with the Visual and Infrared Mapping Spectrometer of the Cassini probe on November 29, 2012. The inset view in the right part of the image corresponds to a natural-color close-up of the high-altitude vortex or cyclone acquired by the Wide-Angle Camera of the Cassini probe on July 25, 2012.
Three different compounds can be discerned in the VIMS view due to their specific color. The surface of the Opaque Moon appears orange near the center of the disk. The atmospheric haze appears light green in the upper part of the disk along the limb. The high-altitude southern polar vortex appears blue in the spectral image of the disk.
The VIMS data reveal a particular spectrum for the southern polar vortex, compared to the rest of the atmosphere. This spectrum corresponds to the signature of frozen hydrogen cyanide molecules or HCN molecules. The finding implies that the atmosphere of the southern hemisphere may be cooling much faster than expected or anticipated.
The solar energy will progressively go down and the environmental temperature is expected to decrease as the Autumn season is advancing in the southern hemisphere and as the Winter season in the southern hemisphere is approaching. Researchers hope to get a better or clearer view of seasonal cycles on Titan. The VIMS view was processed by Remco de Kok.

Image Credit: NASA/JPL-Caltech/ASI/University of Arizona/SSI/Leiden Observatory and SRON.


The three views in the upper part of the table correspond to radar portions of a surprisingly dynamic feature in the famous north polar sea Ligeia Mare, likely composed of a mixture of methane and ethane. The three views in the lower part of the table show the same area with the scale, the date and the limits of the enigmatic feature incorporated. The images were produced on the basis of the Synthetic Aperture Radar (SAR) data obtained from the Radar Mapper of the Cassini probe.
A radar view of the coastline of Ligeia Mare taken on July 10, 2013 had revealed what appeared to be a new feature off the coast. This bright feature seemed to be a new island because a radar view of the same area acquired on April 26, 2007 shows that this bright feature is absent and the sea where the island appears to have emerged seems to be completely dark and uniform. Some researchers have dubbed this bright feature the "Magic Island". In fact, this intriguing feature had not been observed in previous SAR observations of the area from 2007 to 2009. The radar view of the region captured on August 21, 2014 shows a significant change in the appearance of the enigmatic feature. The feature seems to have enlarged itself and diluted. The three views clearly reveal that the feature is particularly dynamic but its nature and its origin are still unknown.
 The radar view in the middle of the mosaic incorporates in its upper part a portion of the radar view taken during the Titan fyby of April 26, 2007 because there was no SAR coverage of the area during the July 10, 2013 flyby. The topographic changes seem to be found, only, in the lower part of the radar view. Observations from the Visual and Infrared Mapping Spectrometer of the Cassini spacecraft performed after the radar view of July 10, 2013, later in July and in September 2013 didn't show the bright feature or the Magic Island and low-resolution SAR views acquired in October 2013 also failed to identify the feature.
However, the SAR image of August 21, 2014 clearly shows that the feature is still there but its shape, its size and its appearance have evolved. Eleven months after it was last observed, the feature seems to have doubled in size from approximately 30 square miles or 75 square kilometers to about 60 square miles or 160 square kilometers. Those observations bring precious clues for the ongoing analyses regarding the nature of the feature.
The Cassini radar team has put forward several hypotheses, in particular the hypothesis of surface waves, the hypothesis of rising bubbles, the hypothesis of floating solids or the hypothesis of solids suspended just below the surface. The feature may also correspond to something more exotic such as a monster or a group of microorganisms. Some scientists believe that the dynamic feature may be closely related to changing seasons as the Summer season is approaching in the northern hemisphere. Researchers will continue to focus their attention on the level and on the shape of the lake or sea to better understand the dynamics of seasons on Titan.

Image Credit: NASA/JPL-Caltech/ASI/Cornell.


This image shows a cloud system developing over the north polar lake or sea Ligeia Mare on Saturn's largest moon Titan. The view is one of the images taken from the Cassini probe between July 20 and July 22, 2014 as it moved away from the Orange Moon following a close flyby. An animated sequence was created on the basis of the different images of the area during this two-day period. The animated sequence reveals dynamic clouds developing and dissipating over Ligeia Mare. Let's note that the timing between images in the sequence can greatly vary since there is a 17.5-hour difference between the second and third frames whereas the difference between most other frames is only one to two hours.
The researchers have seized an opportunity to monitor the evolution of the cloud activity level in the north polar area and there seems to be an increase in cloud activity in the area. The movement of clouds in the animation allowed scientists to determine that wind speeds are approximately 7 to 10 miles per hour or 3 to 4.5 meters per second (10.8 to 16.2 km per hour). Computer models predict an increase in cloud activity in the high latitudes of the northern hemisphere as the Spring season advances and the Summer season approaches and develops in the northern hemisphere. The clouds and the lakes or seas may be composed of methane.

Image Credit: NASA/JPL-Caltech/Space Science Institute.


The image in the upper part of the table centered on Titan's north polar region clearly reveals the famous seas or lakes Ligeia Mare, Punga Mare and Kraken Mare as well as a cloud system developing over the large methane sea Ligeia Mare. The view in the lower part of the table shows the same region with indications on the main features of the area. This orthogonal view was generated on the basis of a reprojection of an image obtained on July 21, 2014 with the Narrow-Angle Camera of the Cassini probe.
Several images of the area were acquired over a two-day period allowing scientists to produce a movie sequence unveiling the dynamics of the methane clouds developing and dissipating over Ligeia Mare. The image was taken as the Cassini spacecraft receded from Saturn's largest moon following a relatively close flyby. The researchers had seized the opportunity to monitor the level of cloud activity in the north polar region or in the high latitudes of the northern hemisphere.
Computer models of the Titanian atmosphere suggest an increase in cloud activity in the north polar region as the Summer season approaches and develops. Is there an increasing cloud activity in the area or is this cloud system over Ligeia Mare exceptional ? The researchers will need to continue to monitor the evolution of cloud activity in the region to confirm their hypothesis based on computer models. They had noticed a decrease in clouds on the Opaque Moon after a large storm occuring in 2010. The level of cloud activity in the north polar region is expected to rise as the Spring season advances and the Summer season takes shape in the northern hemisphere.

Image Credit: NASA/JPL-Caltech/Space Science Institute.


This near-infrared view of Titan’s disk, obtained on January 26, 2014 with the Narrow-Angle Camera of the Cassini probe, unveils, in particular, a discernable band around the north pole. The northern hemisphere of Saturn’s largest moon is currently experiencing the Spring season and is advancing toward the Summer season. Some atmospheric features like this atmospheric banding structure can be better identified in the infrared or near-infrared spectrum than in the visible spectrum.
This image was captured at a distance of about 1.5 million miles or 2.4 million kilometers from the Opaque Moon, using a spectral filter sensitive to wavelengths of near-infrared light centered at 889 nanometers. The camera is orientated toward the leading side of the Orange Moon. North appears in the upper part of the disk and is inclined 31 degrees to the left.

Image Credit: NASA/JPL-Caltech/Space Science Institute.


The image above corresponds to an infrared view of Titan generated, in May 2014, by the SPHERE instrument which has recently been installed on the Very Large Telescope or VLT at the Paranal Observatory in Chile. The Spectro-Polarimetric High-contrast Exoplanet REsearch instrument unveils remarkable details of the tiny disc of the Orange Moon whose apparent diameter is only 0.8 arcsecond, Titan evolving more than 1 billion kilometers away from us.
This view demonstrates the powerful capabilities of the adaptive optics system and reveals the polarimetric capabilities of SPHERE. One of the main goals of SPHERE is to study exoplanets. The image of Saturn's largest moon was acquired at a wavelength of 1.59 micrometers. The surface of Titan can't be observed from here in the visible spectrum because the Titanian atmosphere is dense, thick, deep and opaque. This view reveals surface details because the image was obtained in the infrared spectrum, in a wavelength at which the Titanian atmosphere, mostly composed of nitrogen and methane, is transparent. One can notice the remarkable contrast between dark areas and bright areas.

Image Credit: ESO/J.-L. Beuzit et al./SPHERE Consortium.


The image above reveals a crescent of Saturn's largest moon Titan as well as a surprising crescent of the famous polar vortex taking shape in the south polar region of the Orange Moon. This view demonstrates that this persistent vortex evolves high, in the upper atmosphere because a portion of the vortex forming a crescent is illuminated while the surrounding clouds or the surrounding haze are in the shadow. The south polar region is currently experiencing the Autumn season and the Winter season is approaching. Despite the relatively high inclination in the rotation axis of the moon, the rays from the Sun can reach, in the south polar area, high atmospheric features like this remarkable vortex.
The view was obtained with the Wide-Angle Camera of the Cassini probe on February 3, 2014 using a spectral filter sensitive to wavelengths of near-infrared light centered at 742 nanometers. The image was taken at a distance of about 134,000 miles or 215,000 kilometers from the Opaque Moon. The camera is orientated toward the Saturn-facing hemisphere of the Orange Moon. North is in the upper part of the disc and inclined 32 degrees to the right.

Image Credit: NASA/JPL-Caltech/Space Science Institute.


The view above, obtained on December 1, 2013 with the Wide-Angle Camera of the Cassini probe, shows a crescent of Saturn's largest moon Titan as well as a crescent of the famous south polar vortex. The illuminated side of this vortex or cyclone surrounded by a relatively dark area shows that the vortex glides at a particularly high altitude. One can notice, in particular, the upper layer of the thick, deep, opaque and dynamic atmosphere of the Orange Moon.
The camera is orientated toward the trailing hemisphere of the Opaque Moon. North appears in the upper part of the disk. The image was acquired using a spectral filter sensitive to wavelengths of near-infrared radiation centered at 939 nanometers. The image was taken at a distance of about 108,000 miles or 174,000 kilometers from Titan.

Image Credit: NASA/JPL-Caltech/Space Science Institute.


The radar view above, revealing a portion of Titan's landscape, was obtained from the Radar Mapper of the Cassini probe on July 10, 2013. The image is proposed by a team led by Steve Wall at NASA's Jet Propulsion Laboratory in California, USA. One can notice dark and parallel linear streaks extending over long distances. Those features correspond to dunes reminiscent of the Seif Dunes found in the Namib desert on Earth.
Hydrocarbons and organics are widespread on Titan. The sand on Saturn's largest moon is not composed of silicates. The dunes may be composed of organics and the grains may be roughly the same size as grains on our beach. Their small size and their smoothness imply that the flowing lines carved into the dunes appear dark to the human eye. Prevailing winds, which blow in opposite directions throughout the year, tend to shape the dunes in spite of their slow speed estimated at around 1 meter per second. Some bright topographic obstacles which tend to deflect the orientation of the dunes can be well identified here.

Image Credit: NASA/JPL-Caltech.


The image of Saturn's largest moon Titan above reveals some north polar lakes. The dark lakes or seas may be dominated by liquid methane and liquid ethane. The solar energy received and the environmental temperature are sufficiently low to allow methane and ethane to appear in their liquid form on the surface and, of course, water can only appear in its solid form on the ground. There may be a hydrological cycle involving methane and ethane with evaporation, precipitation and condensation processes similar, to a certain extent, to the water cycle on our planet.
The view of the disk was obtained with the Wide-Angle Camera of the Cassini probe on January 1, 2014 using a spectral filter sensitive to wavelengths of near-infrared radiations centered at 939 nanometers. The illuminated terrain observed here appears on the leading hemisphere of the Orange Moon and north is in the upper part of the disk. The image was taken at a distance of about 114,000 miles or 183,000 kilometers from the Opaque Moon.

Image Credit: NASA/JPL-Caltech/Space Science Institute.


This image shows the disc of Saturn's largest moon Titan and well-known atmospheric features such as the bright south polar vortex and the detached haze to the north of the Orange Moon. The south polar vortex doesn't seem to have weakened over time. This cyclone may continue to develop as the Winter season in the southern hemisphere approaches and develops.
The view was obtained with the ISS Narrow-Angle Camera of the Cassini probe on August 20, 2013 using a spectral filter sensitive to wavelengths of near-infrared radiation centered at 889 nanometers. The camera is orientated toward the Saturn-facing hemisphere of the Opaque Moon. North is in the upper part of the disc and tilted 24 degrees to the left. The image was taken at a distance of about 1.6 million miles or 2.5 million kilometers from the giant moon Titan.

Image Credit: NASA/JPL-Caltech/Space Science Institute.


The three images shown in this table reveal a false color map or mosaic of Titan's north polar region where most of the lakes or seas can be found. This map was generated on the basis of radar data obtained from the Radar Mapper of the Cassini probe from 2004 to 2013. The north pole can be found at the center of the disc. The map ranges from 50 degrees north latitude to 90 degrees north latitude or to the north pole. The blue or dark areas which appear relatively uniform represent lakes, seas or rivers whereas the yellow or brown areas represent dry land or icy areas. The surface bodies of liquids may be dominated by methane and ethane.
Kraken Mare, Ligeia Mare and Punga Mare, which are the largest lakes or seas in the north polar region, can be clearly noticed here. Scientists are trying to understand why the surface liquids are mainly concentrated in the area of Kraken Mare. Some geologic phenomena may account for the development of the lakes or seas. The lakes or seas can take shape in topographic depressions related to a regional extension of the crust which engenders, on our planet, faults generating alternating basins and roughly parallel mountain ranges. The view in the lower part of the table reveals the names of the myriad of major lakes or seas in the north polar region. One can mention in particular Neagh Lacus, Bolsena Lacus, Jingpo Lacus or Sparrow Lacus which appear to be significant lakes relatively close to the three famous lakes or seas of the north polar region.
How to explain the fact that the north polar region is, today, largely damper than the south polar region ? This dichotomy between the south polar region and the north polar region may be related to seasonal factors. As the Winter season approaches in the southern hemisphere, the south polar area may become damper and damper due to condensation processes. By contrast, as the Summer season approaches in the northern hemisphere, the north polar area may become less and less damp due to strong evaporation processes. Researchers will monitor the level of the lakes or seas or the evolution of the shape of the lakes or seas in the next few years to verify if this theory is correct.

Image Credit: NASA/JPL-Caltech/ASI/USGS.

Titan Images 2013
Titan Images 2012

Titan Images 2011
Titan Images 2010
Titan Images 2009
Titan Images 2008
Titan Images 2007
Titan Images 2006
Titan Images 2005, 2004

Back to main page