Titan Images 2009
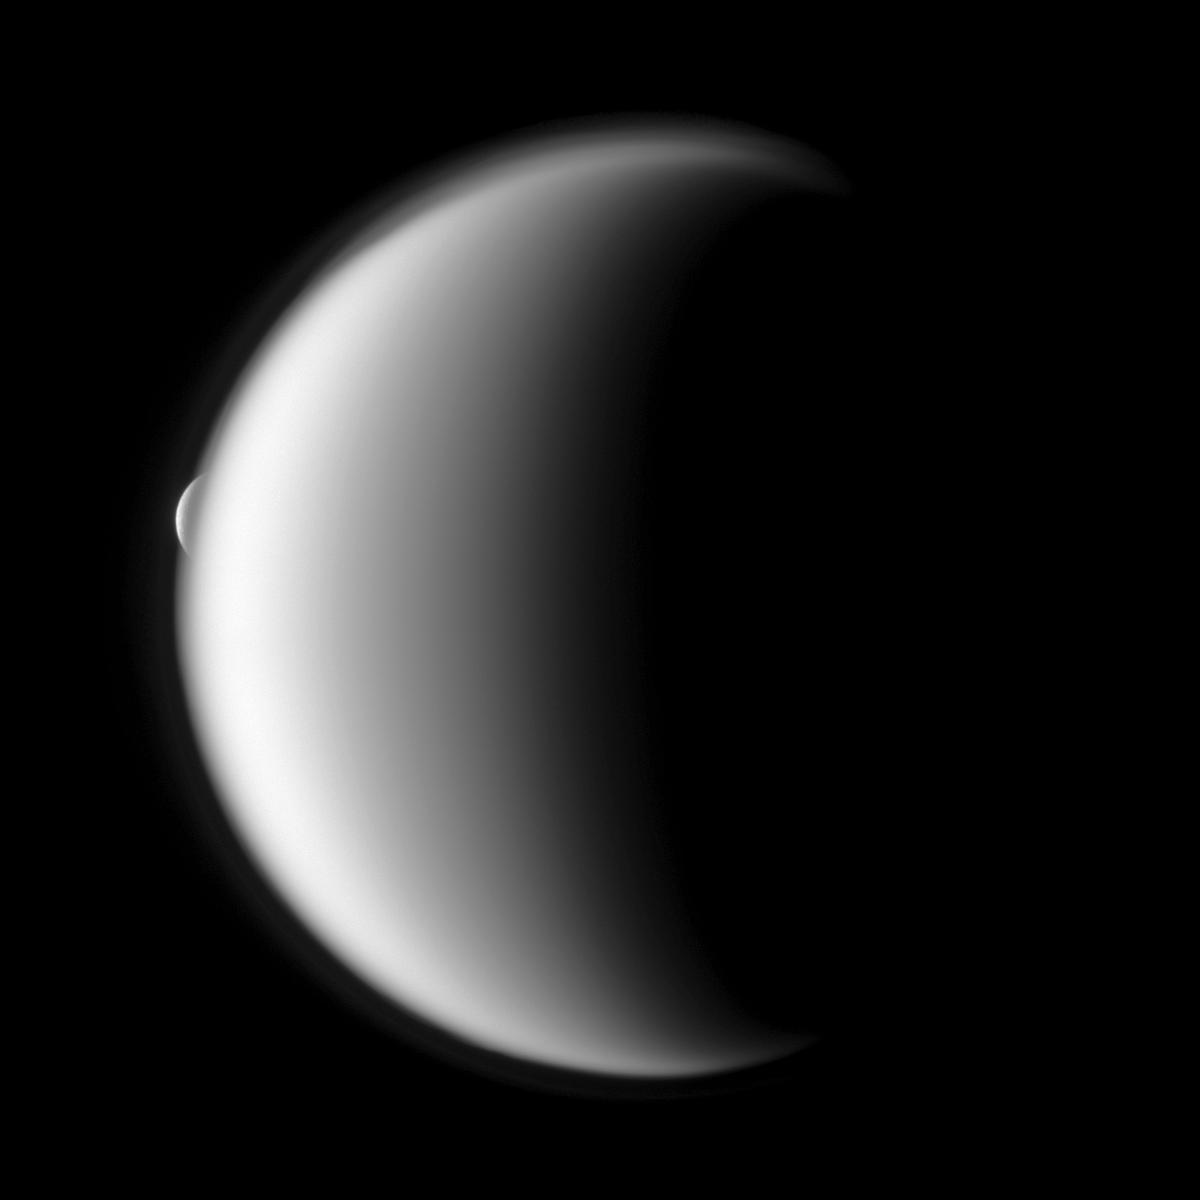 |
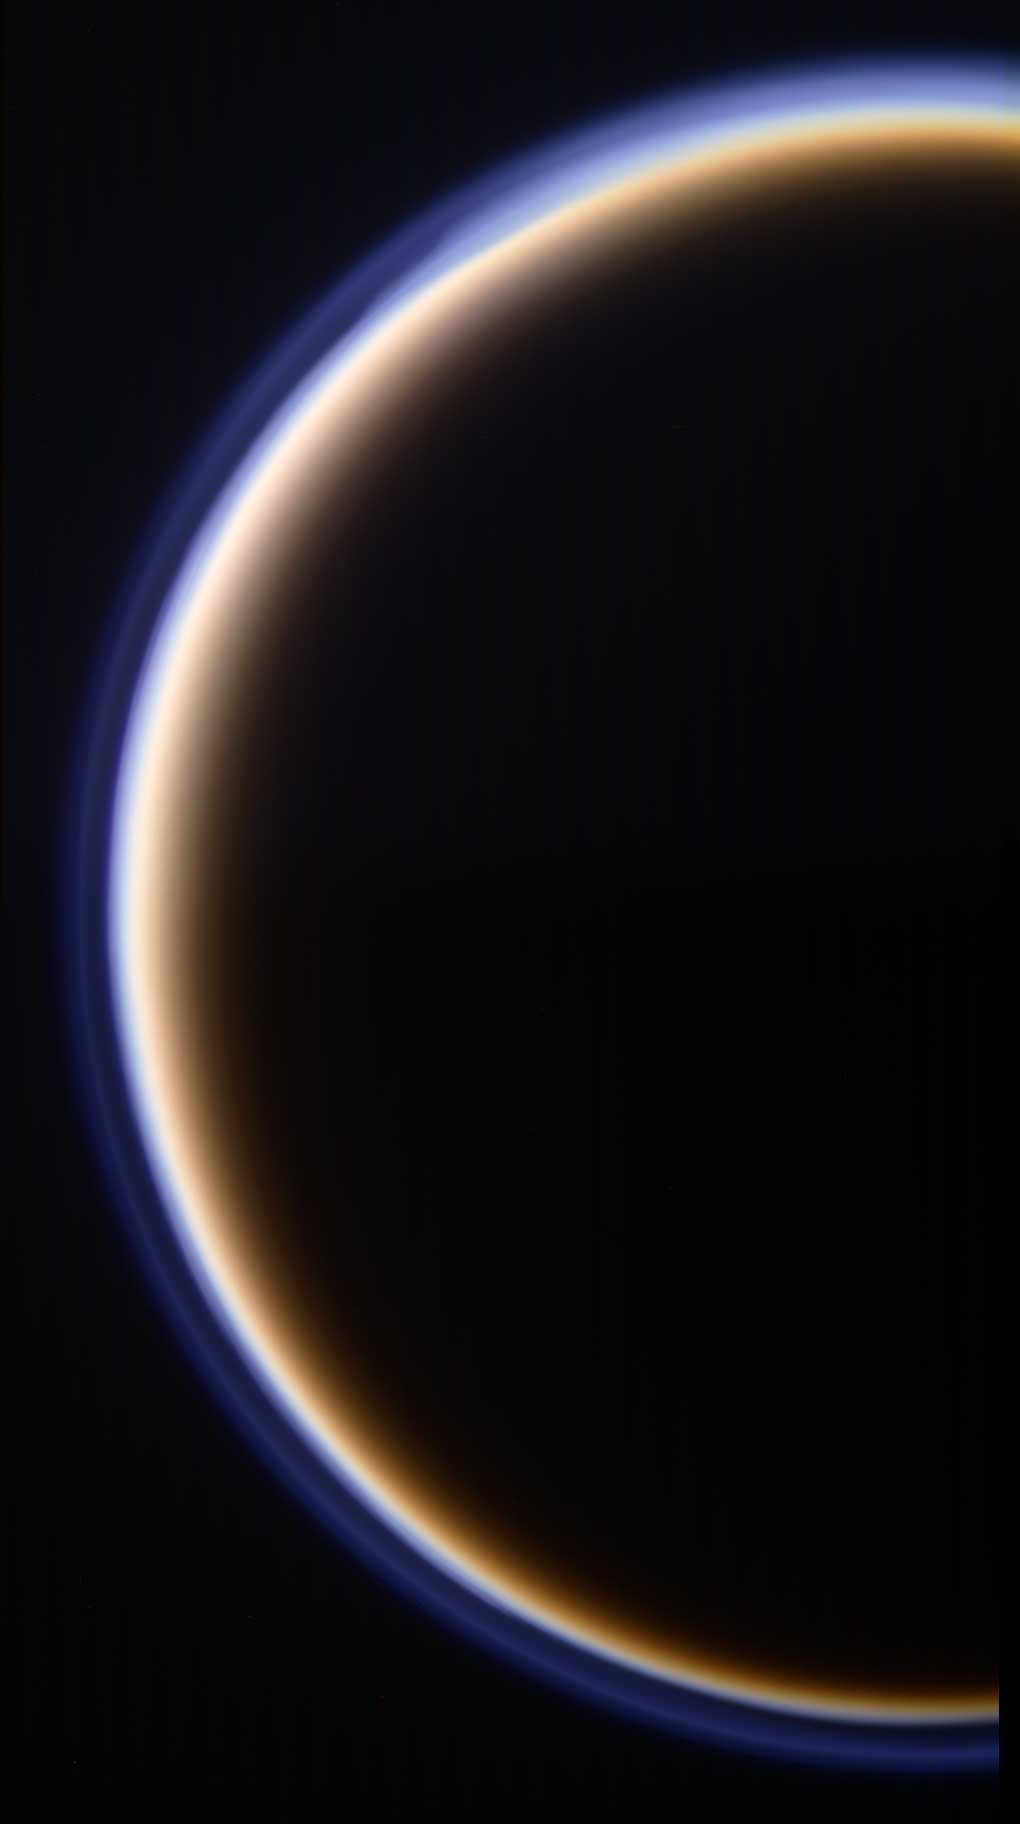
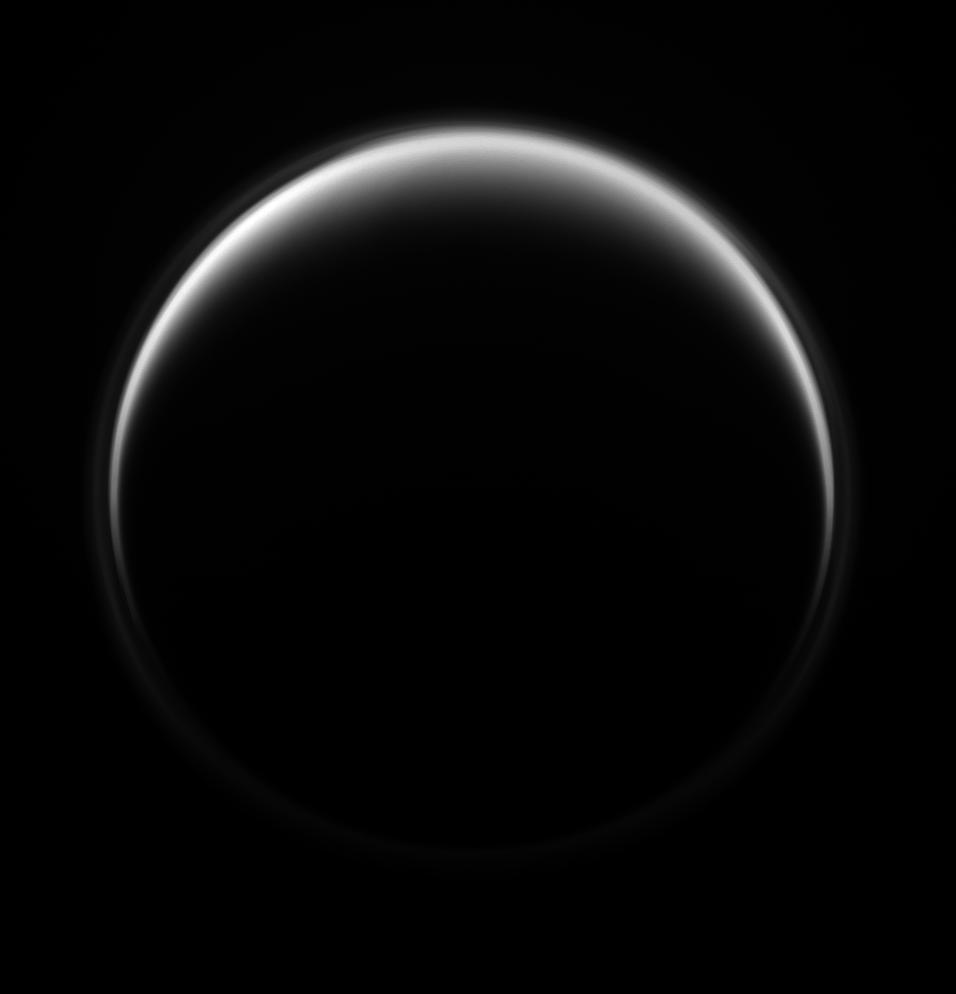
This visible light view shows
the disk of Titan in the foreground and a crescent of the icy moon
Rhea
through Titan's upper atmosphere in the background. Rhea emerges
after being occulted by Saturn's largest moon. Credit: NASA/JPL/Space Science Institute |
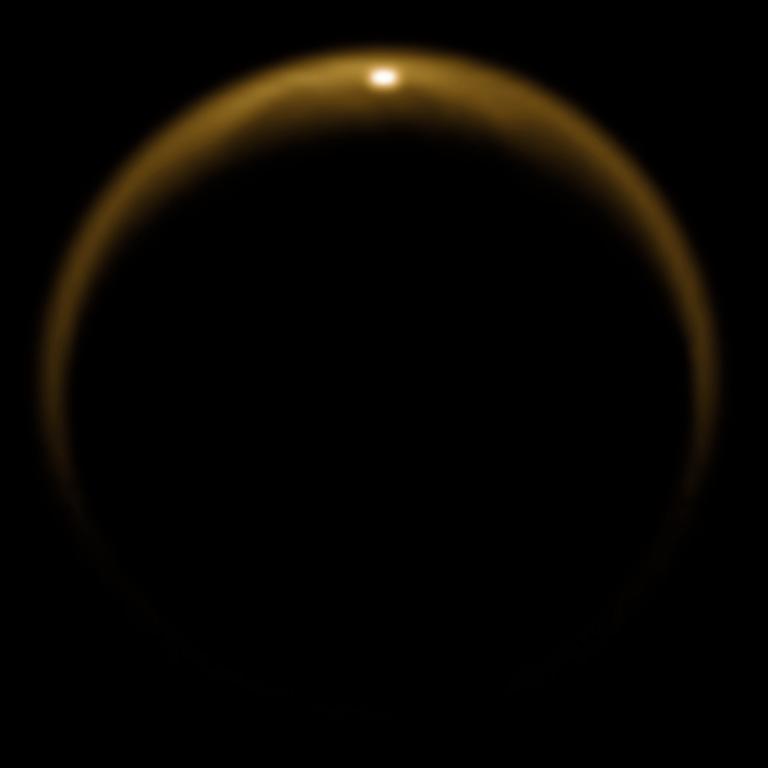 |
This infrared view of Titan's
disk reveals the first glint from a liquid body. In the upper part
of the disk, in the northern hemisphere of Saturn's largest moon, one
can clearly observe a flash of sunlight which is the outcome of a light
reflection on a smooth or mirror-like surface. This phenomenon is known
as a specular reflection. Credit: NASA/JPL/University of Arizona/DLR |
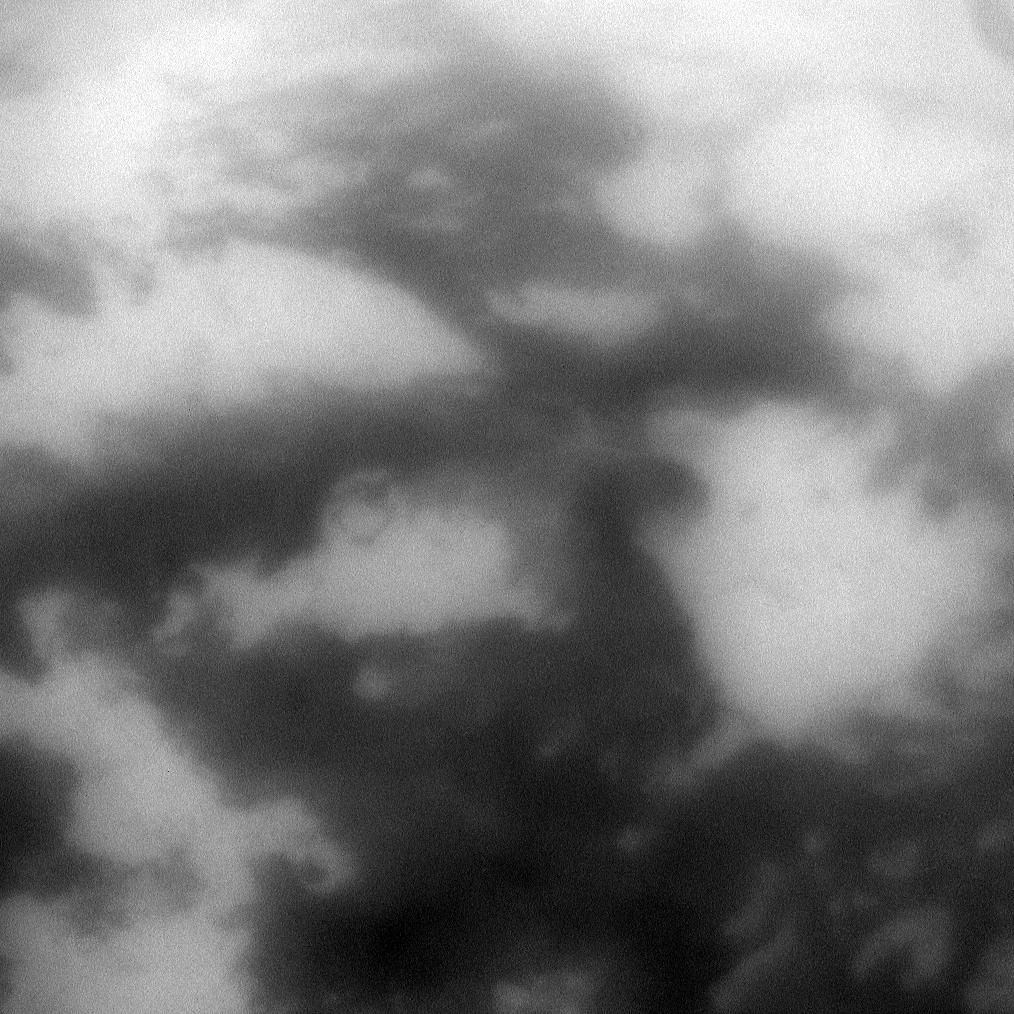 |
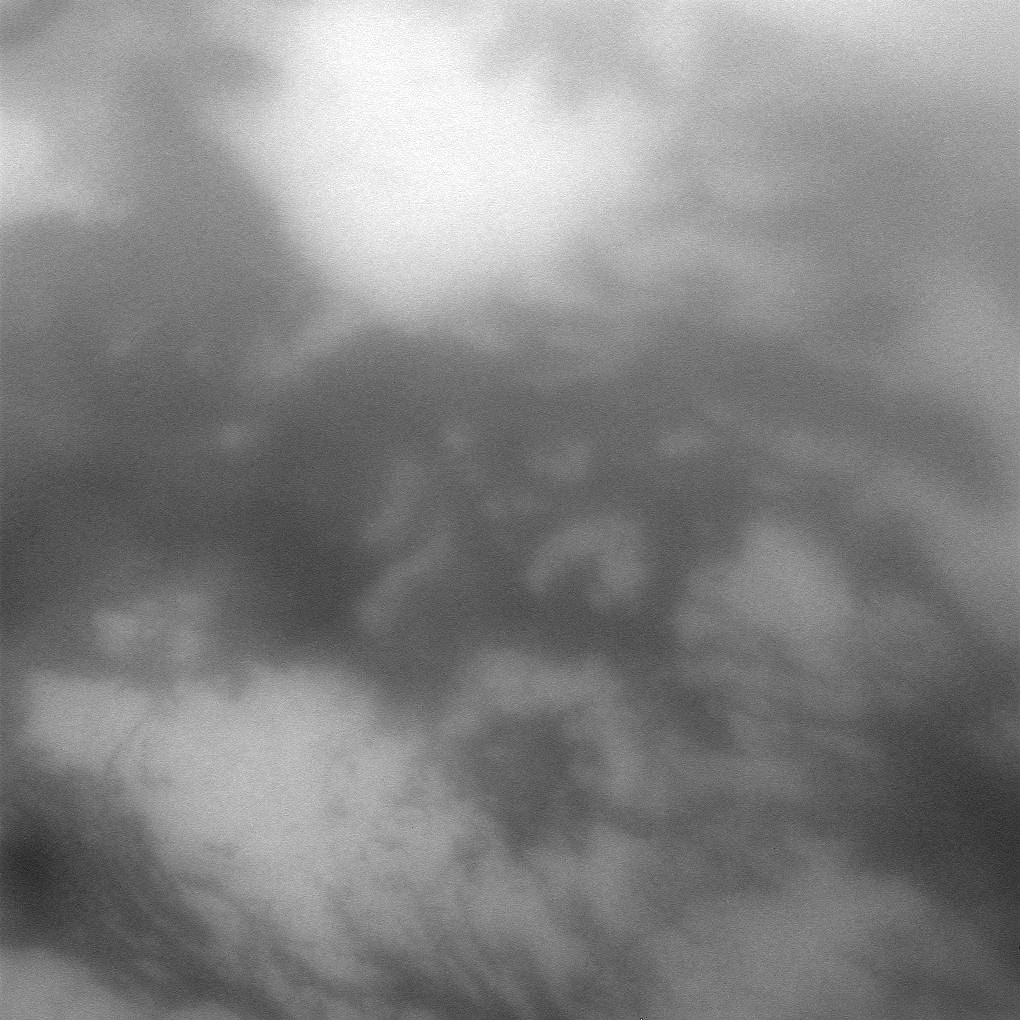
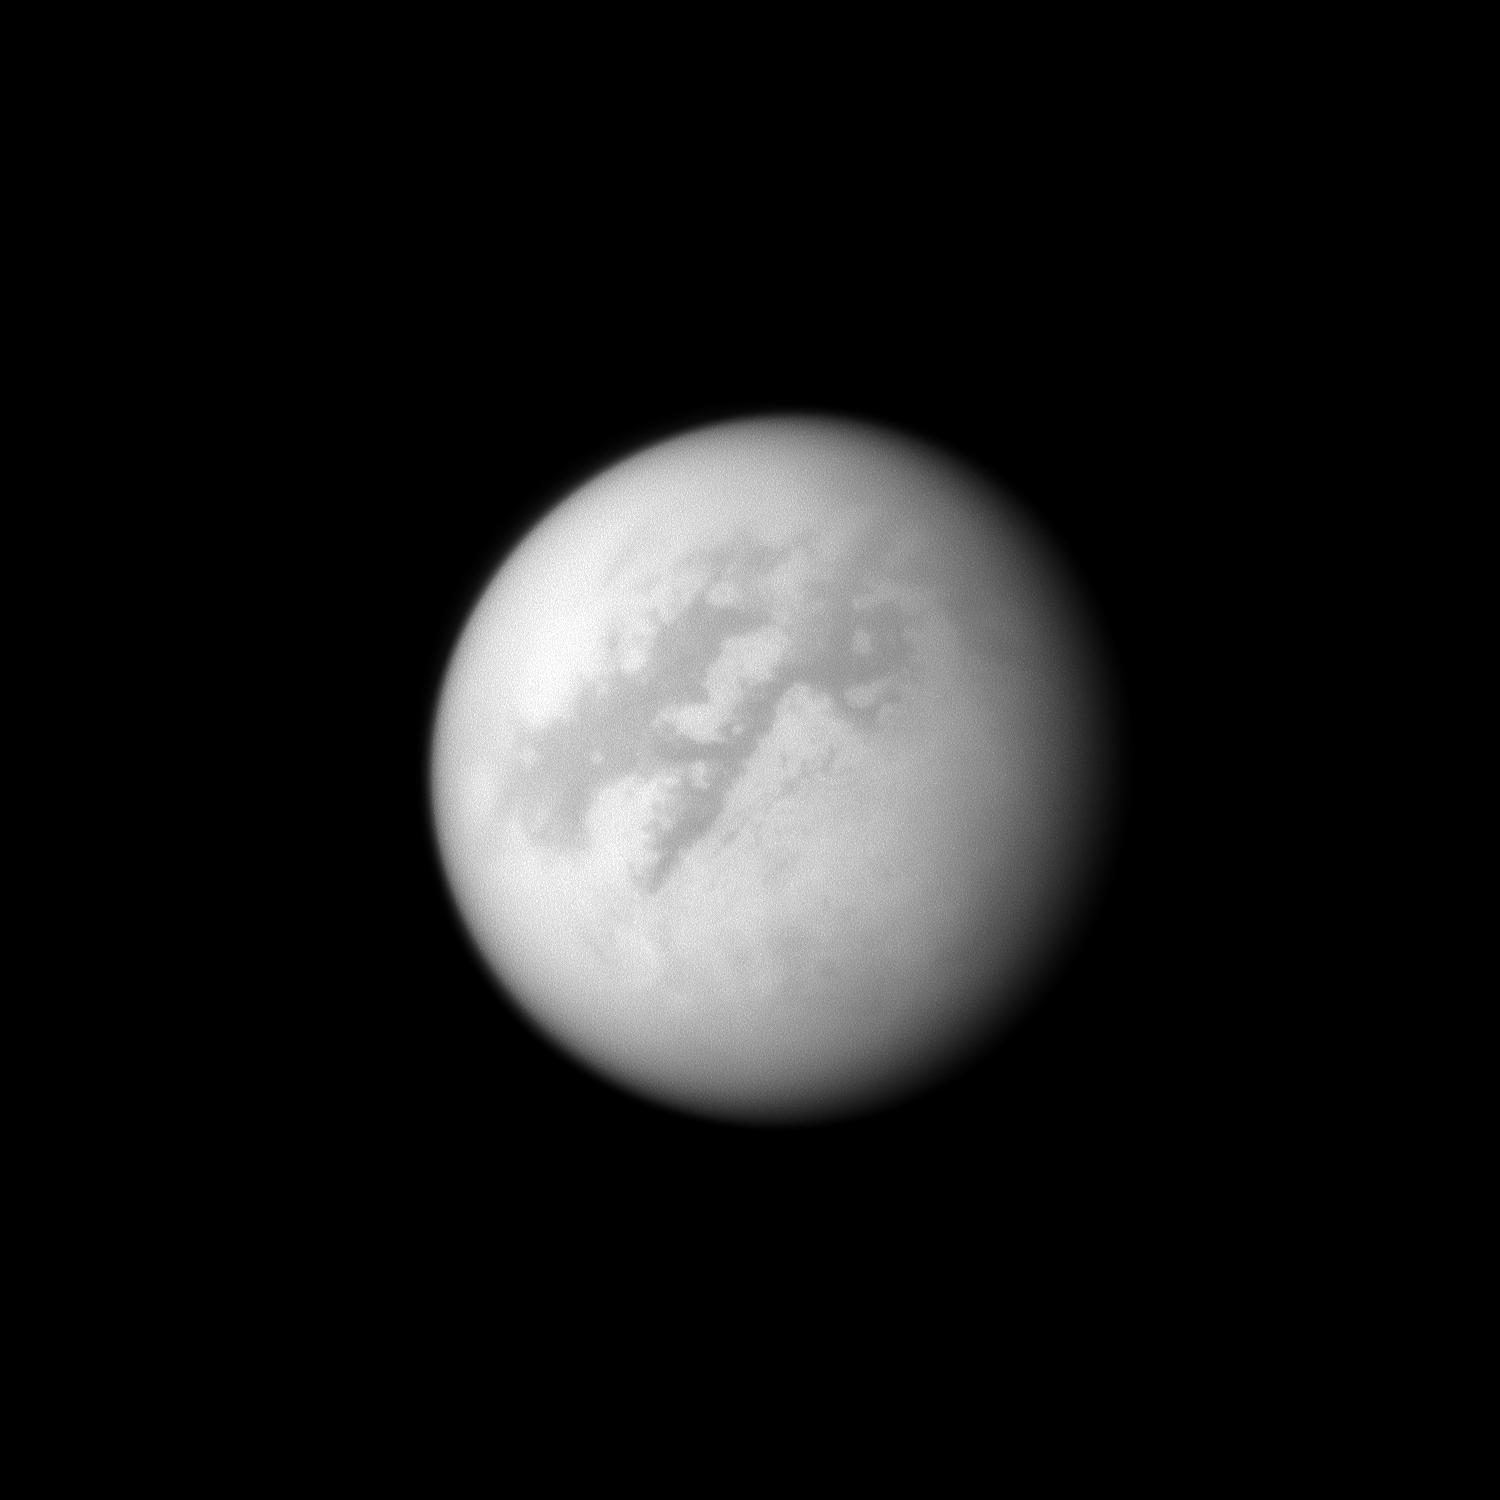
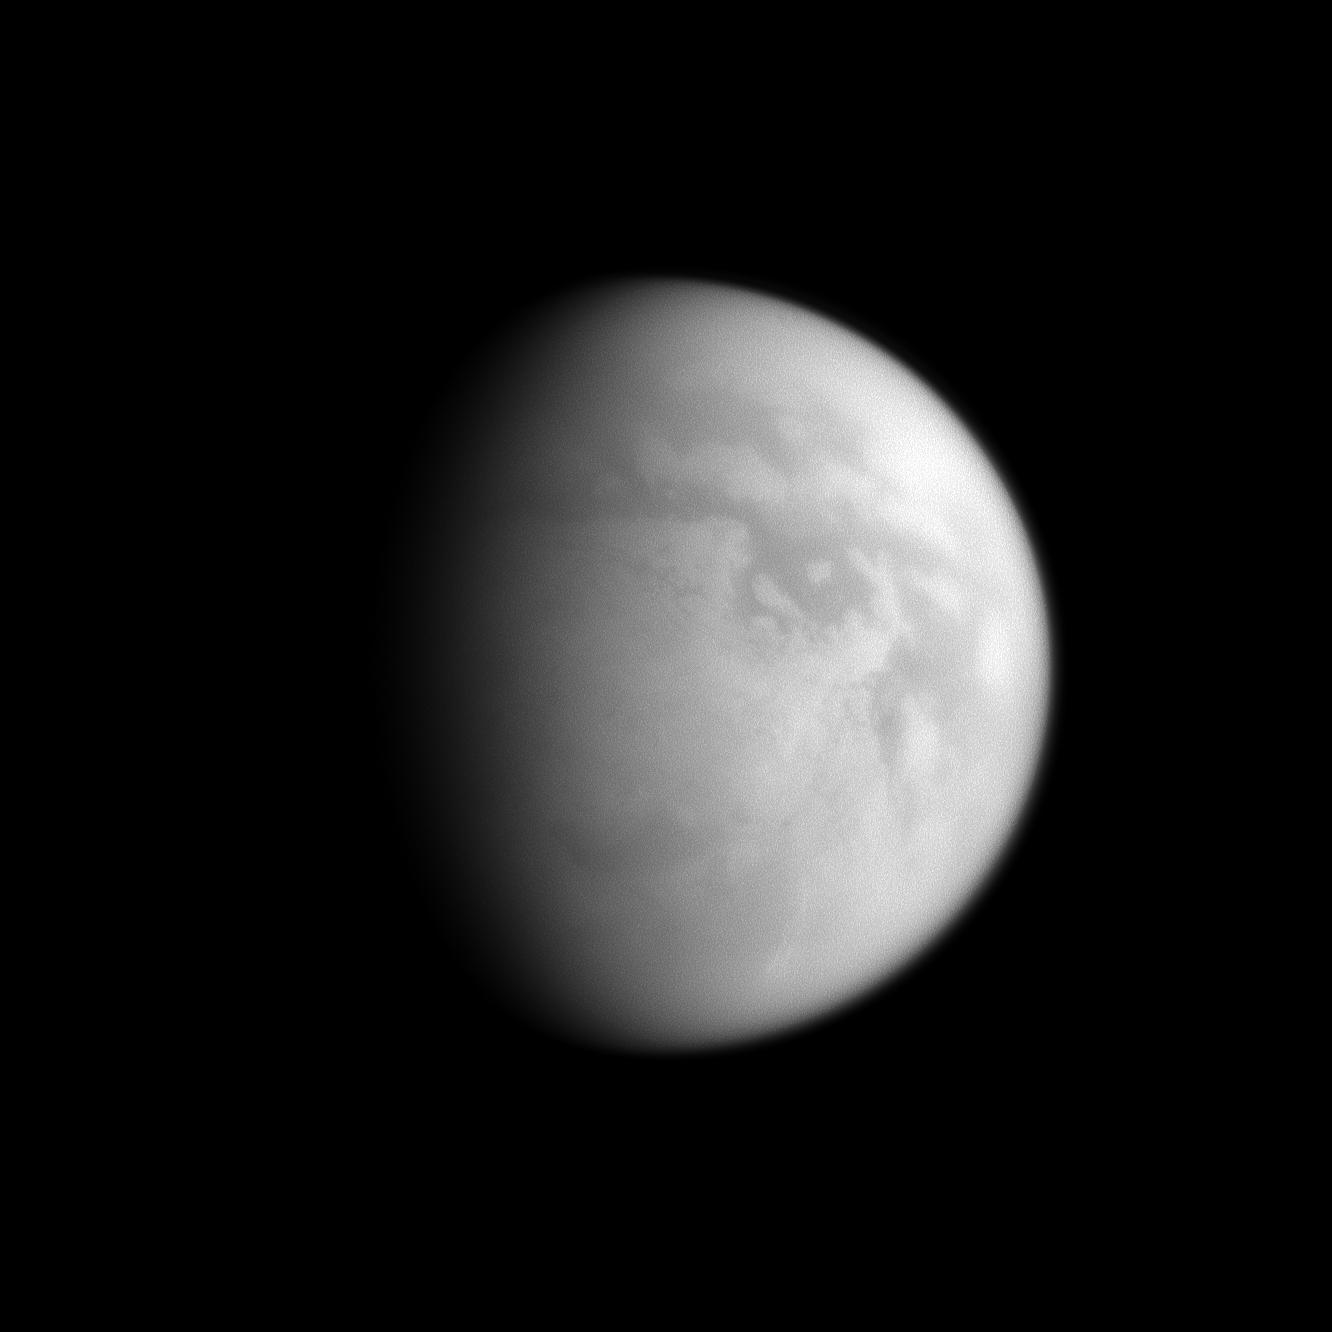
This near-infrared view shows
a low-albedo area of Titan known as Senkyo. This region which appears
mostly dark is located near the equator of Saturn's largest moon.
This
portion appears on the Saturn-facing side of the Orange Moon and
the region is centered on terrain at 1 degree south latitude, 345
degrees
west longitude. North appears to the top of the view and is tilted
10 degrees to the right. Credit: NASA/JPL/Space Science Institute |
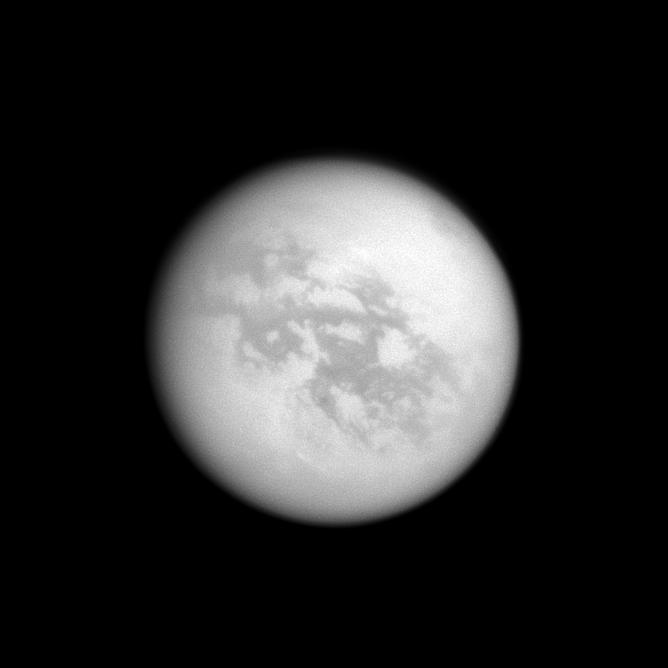 |
This near-infrared view of Titan's
disk reveals the southern portion of what appears to be the largest
body of liquids on Saturn's largest moon, named Kraken Mare. Credit: NASA/JPL/Space Science Institute |
 |
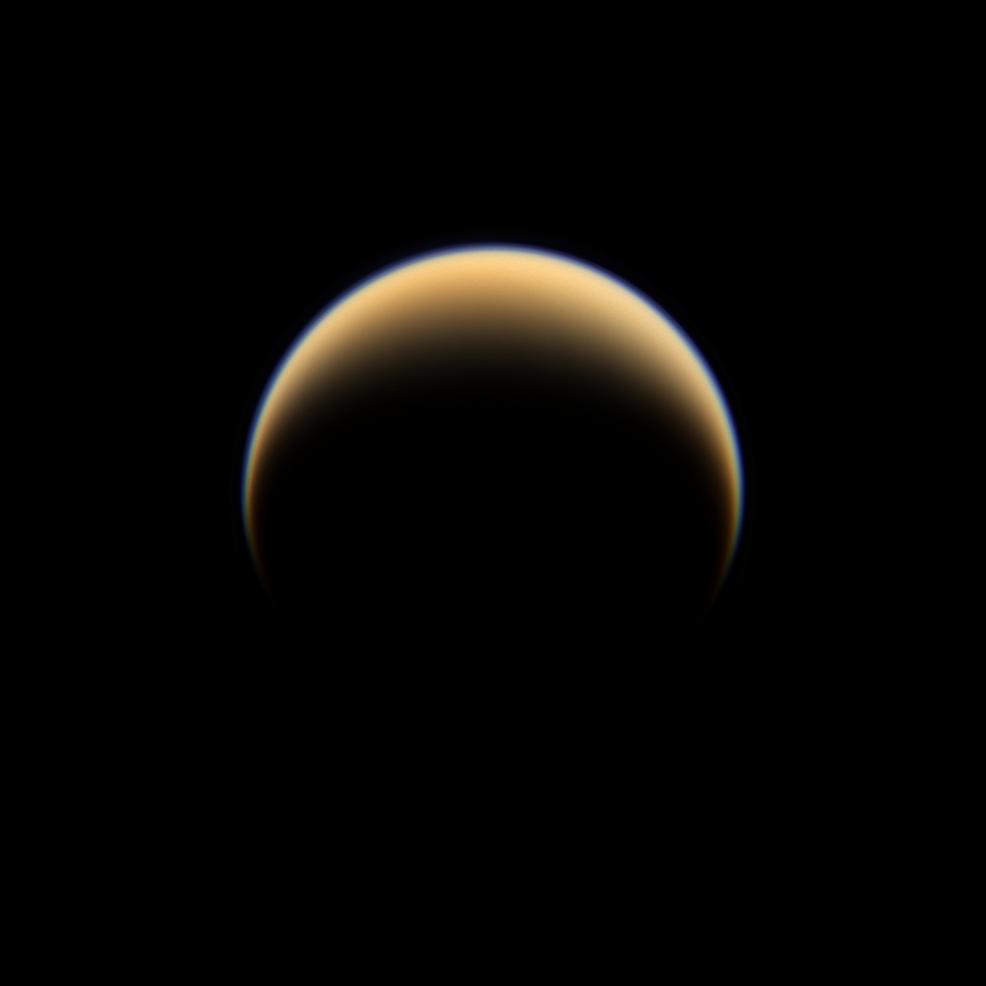
This ultraviolet image of Titan's
disk unveils the detached, high-altitude global haze layer of the deep,
opaque and complex atmosphere of Saturn's largest moon. Credit: NASA/JPL/Space Science Institute |
 |
This mosaic image
of a portion of Titan's disk unveils the upper layer of the complex
atmosphere of Saturn's largest moon. The blue ring at the border of the
orange atmosphere appears to be a detached haze layer made of organic molecules
which undergo the action of Ultraviolet light coming from the Sun. Credit: NASA/JPL/Space Science Institute |
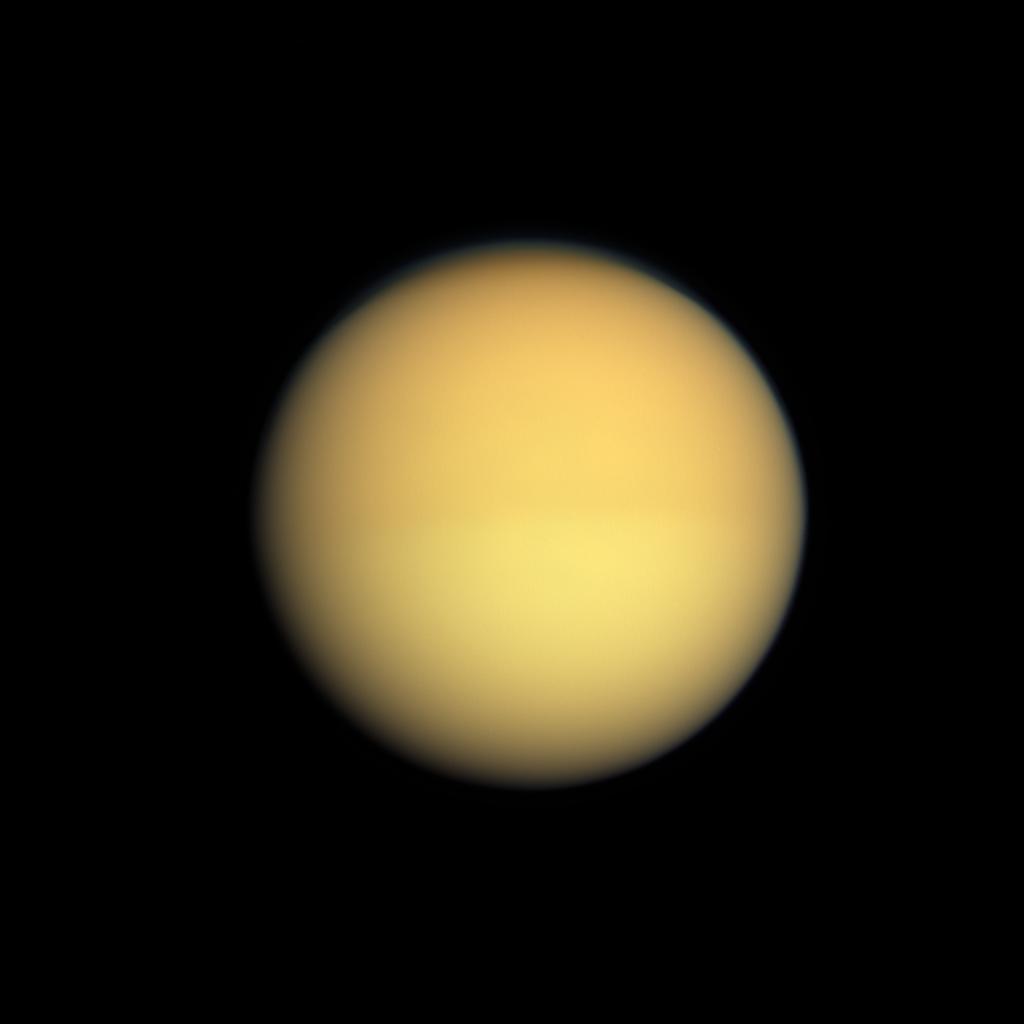 |
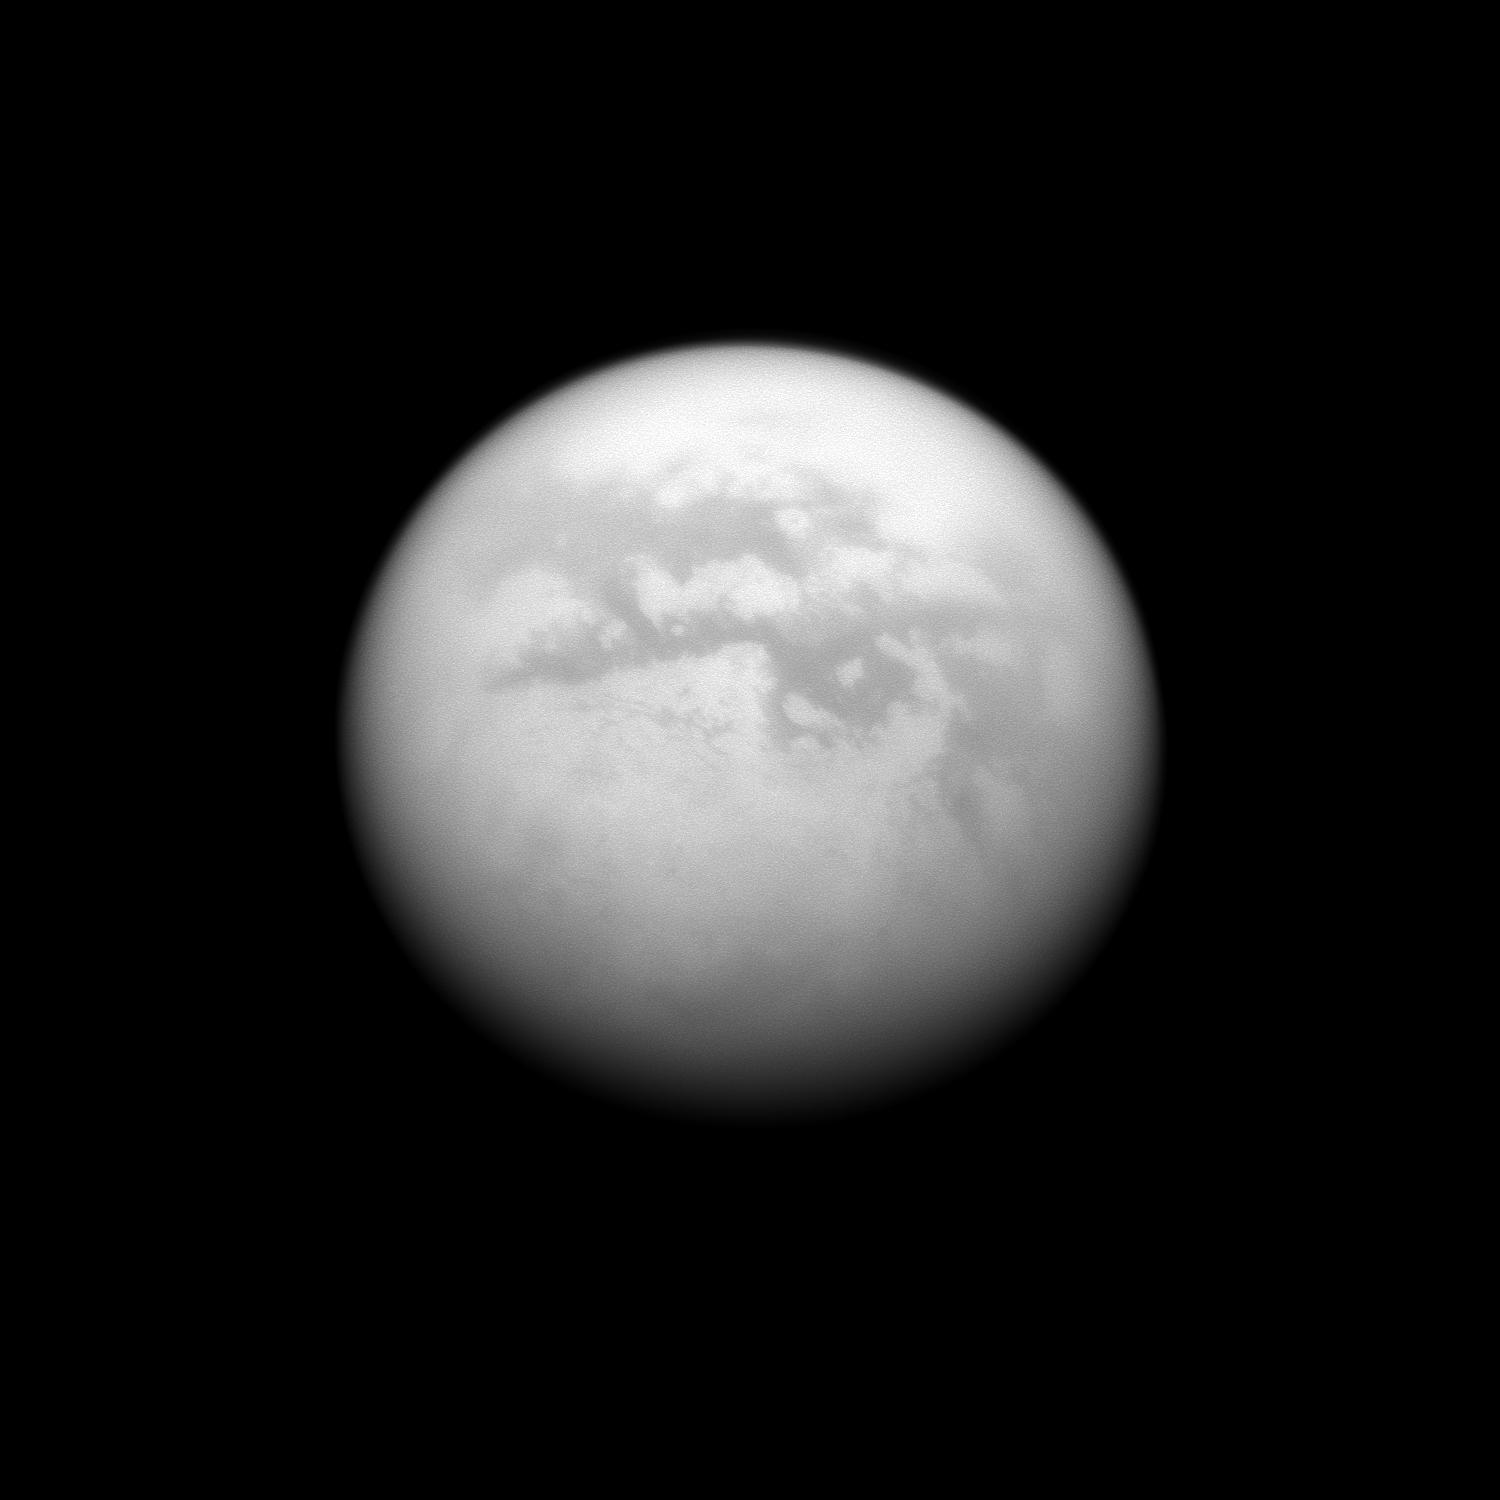
This natural color view of the Orange
Moon, Titan, reveals the slight atmospheric dichotomy between the northern
portion and the southern portion of the globe. Credit: NASA/JPL/Space Science Institute |
 |
This global view of Titan's disk,
taken in the ultraviolet spectrum, clearly shows the north polar hood
of Saturn's largest moon. One can also notice the detached, high altitude
haze layer in the upper part of the opaque atmosphere. Credit: NASA/JPL/Space Science Institute |
 |
This near-infrared view reveals
a portion of the low-albedo feature Senkyo in Titan's southern hemisphere.
The area is centered at 28 degrees south latitude, 334 degrees west
longitude and it lies on the trailing hemisphere of Saturn's largest
moon. Image Credit: NASA/JPL/Space Science Institute |
 |
This global view of Titan's disk
unveils the halo-like ring taking shape in the upper hazes of the
deep and opaque atmosphere of Saturn's largest moon. Image Credit: NASA/JPL/Space Science Institute |
 |
This view of Titan's disk clearly
shows the radar-dark regions of Fensal and Aztlan forming a topographic
H along the equatorial region. Image source: NASA
/ JPL/Space Science Institute |
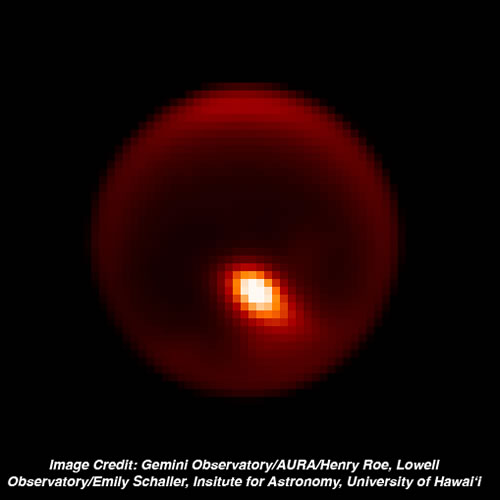 |
This global view of Titan's disk
unveils a cloud outburst in Titan's tropics. The near-infrared image,
taken in the 2.12 micron wavelength, was obtained on April 14, 2008
(UTC) with the Gemini North Telescope using
adaptive
optics. Saturn's largest moon is approximately 0.8 arcsecond across
in this view. Image Credit: Gemini Observatory/AURA/Henry Roe, Lowell Observatory/Emily Schaller, Institute for Astronomy, University of Hawai'i |
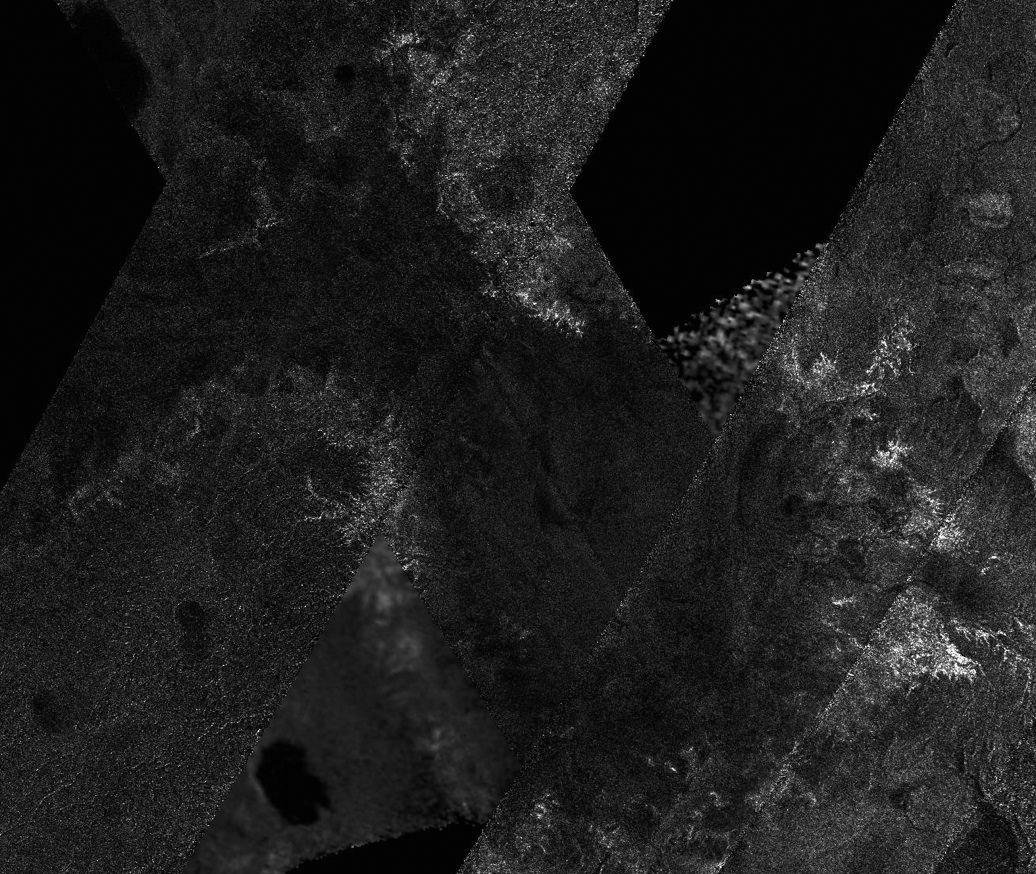 |
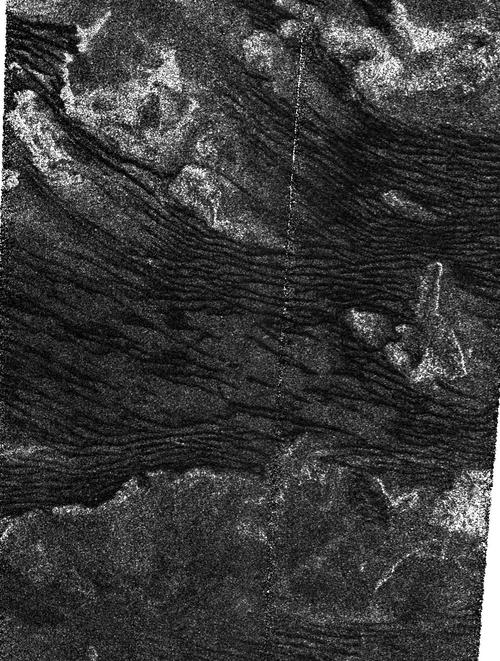
This radar mosaic made of several
swaths acquired by the Synthetic-Aperture Radar (SAR) of the
Radar Mapper aboard the Cassini probe features a complex landscape
in Titan's
south
polar region. The radar-dark region is several hundred kilometers
across. The area is centered near 82 degrees south, 205 degrees west
and it
is composed of data from the following Titan flybys: T39, T55, T57,
T58 and T59. These radar swaths were collected between December 2007
and July 2009. The interpretation of the radar features must take
into account variations in resolution and illumination angle of the
swaths
which engender changes in appearance. Thus, the edges between the
swaths can be clearly identified and similar surface features are
likely to
show a different albedo depending on the resolution and on the illumination
angle of the swath. The overall view enables us, however, to discern
the general landscape features. Image source: NASA / JPL |
 |
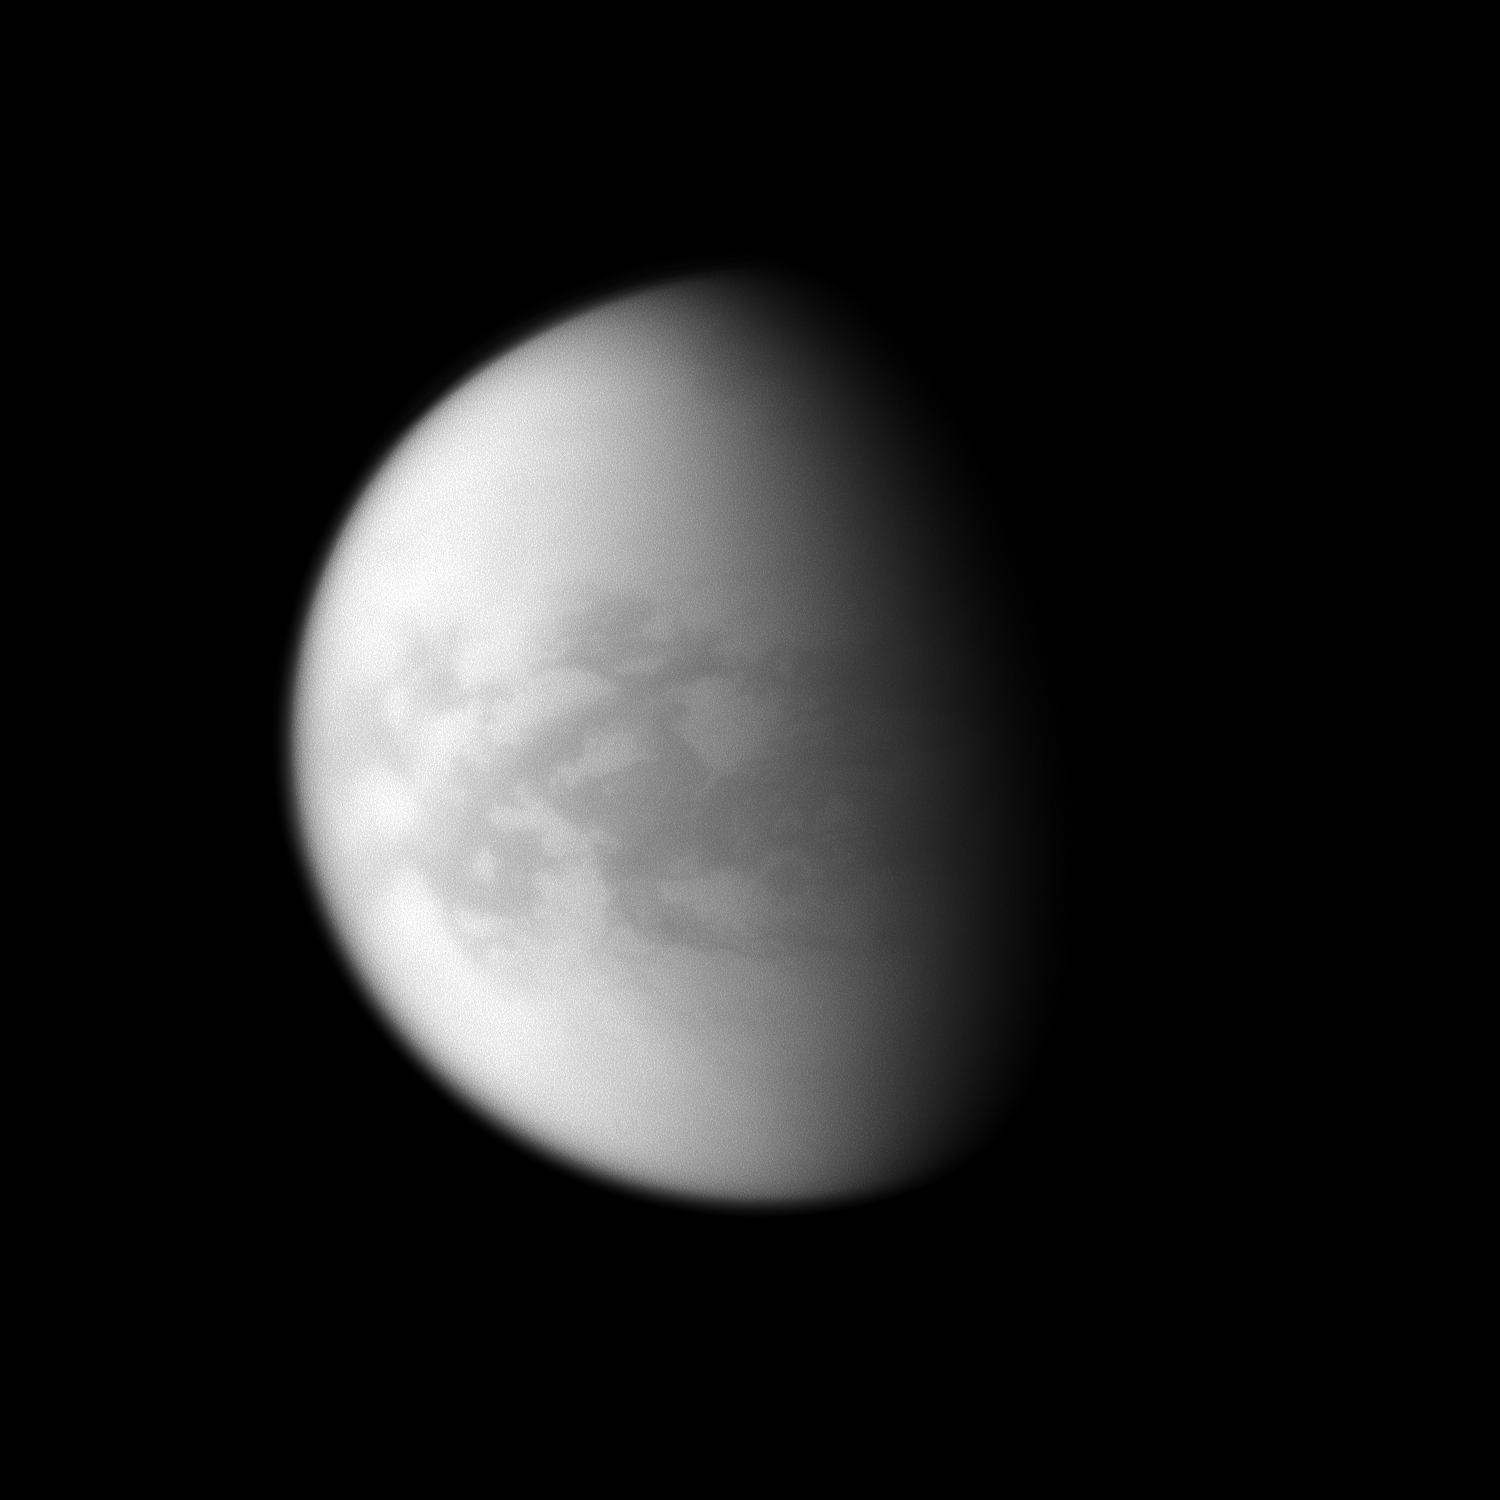
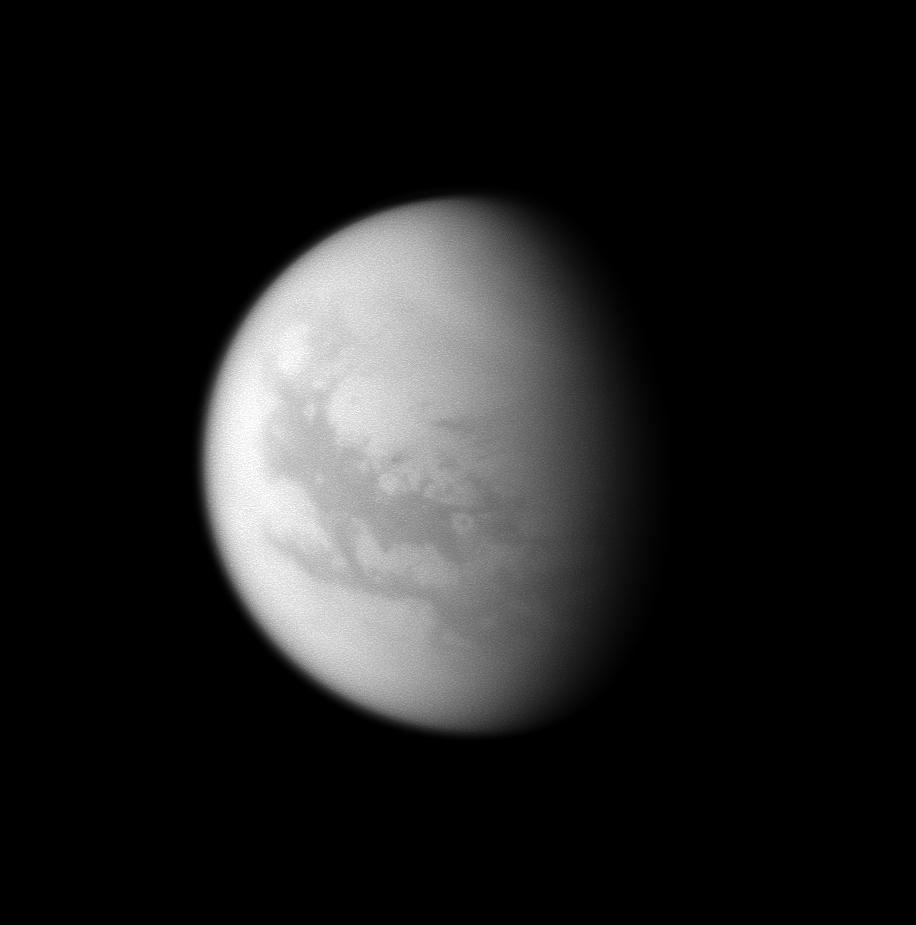
This natural color view of Saturn's
largest moon, Titan, reveals night and day in the northern hemisphere
plunged into the winter period. The shot was obtained with the ISS
wide-angle camera onboard the Cassini spacecraft on June 6, 2009
at a distance
of about 194,000 kilometers (121,000 miles) from the Orange Moon.
Views captured using red, green and blue spectral filters were combined
to
generate this outcome. The view of the disk is centered at 49 degrees
north latitude, 243 degrees west longitude. The north pole is tilted
approximately 23 degrees to the left and it is located on the terminator
above and to the left of the center of the shot. Image source: NASA / JPL / Space Science Institute |
 |
This near-infrared view of Titan's
disk was captured with the Cassini probe narrow-angle camera on May
25, 2009. The image was obtained at a distance of about 1.3 million
kilometers (808,000 miles) from the Orange Moon and at a Sun-Titan-spacecraft,
or phase, angle of 25 degrees, using a spectral filter sensitive to
wavelengths of near-infrared light centered at 938 nanometers.North
appears to the top and is inclined 38 degrees to the left. Image source: NASA / JPL / Space Science Institute |
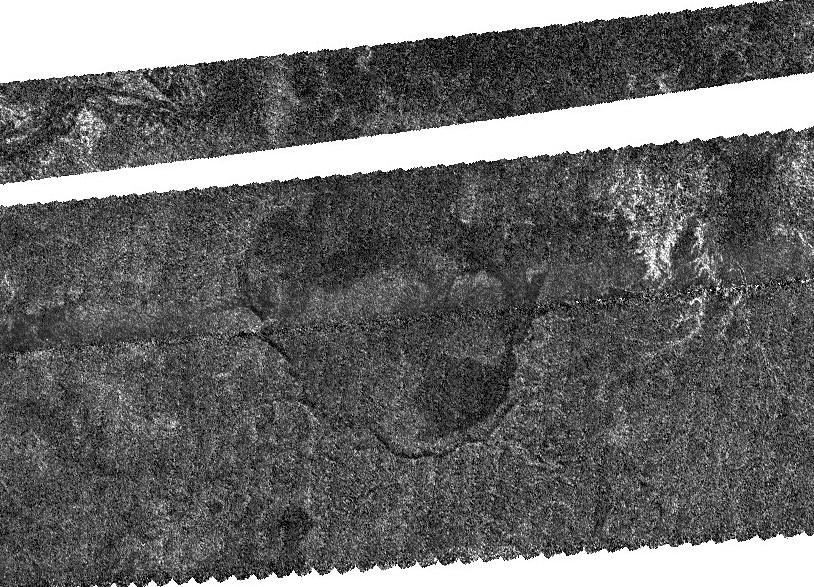 |
This radar portion of Titan's south
polar region, obtained by the Radar Mapper of the Cassini probe on
June 22, 2009, shows an intriguing large basin at its center. The view
is centered near 76.5 degrees south latitude, 213 degrees west longitude
and it covers an area of 190 by 140 kilometers (118 to 87 miles). The
basin is estimated to be 100 kilometers wide (62 miles). The radar
illumination comes from the left, and the incidence angle is approximately
45 degrees. The upper part of the basin is cut by an horizontal white
corridor which corresponds to a data gap in the preliminary version. Image source: NASA / JPL |
 |
This global view of Titan's disk
was obtained in violet light with the ISS Wide-Angle Camera of the
Cassini probe on May 21, 2009. The image was captured at a distance
of about 147,000 kilometers (91,000 miles) from Saturn's largest moon
and at a Sun-Titan-spacecraft, or phase, angle of 121 degrees. The
exposed area observed here is on the trailing hemisphere of the Orange
Moon, which is facing Saturn. This shot is centered on 54 degrees north
latitude, 251 degrees west longitude. The north pole of the Hazy Moon
is located on the terminator approximately one-third of the way inward
from the upper part of the view. Image source: NASA / JPL / Space Science Institute |
 |
This near-infrared view of Saturn's
largest moon, Titan, notably reveals the dark region of Senkyo in the
center of the image. Senkyo can be spotted just south of the equator
at a longitude of about 330 degrees west. Geographically, Senkyo lies
between the dark regions of Fensal and Aztlan to the west and the dark
region of Belet to the east. Image source: NASA / JPL / Space Science Institute |
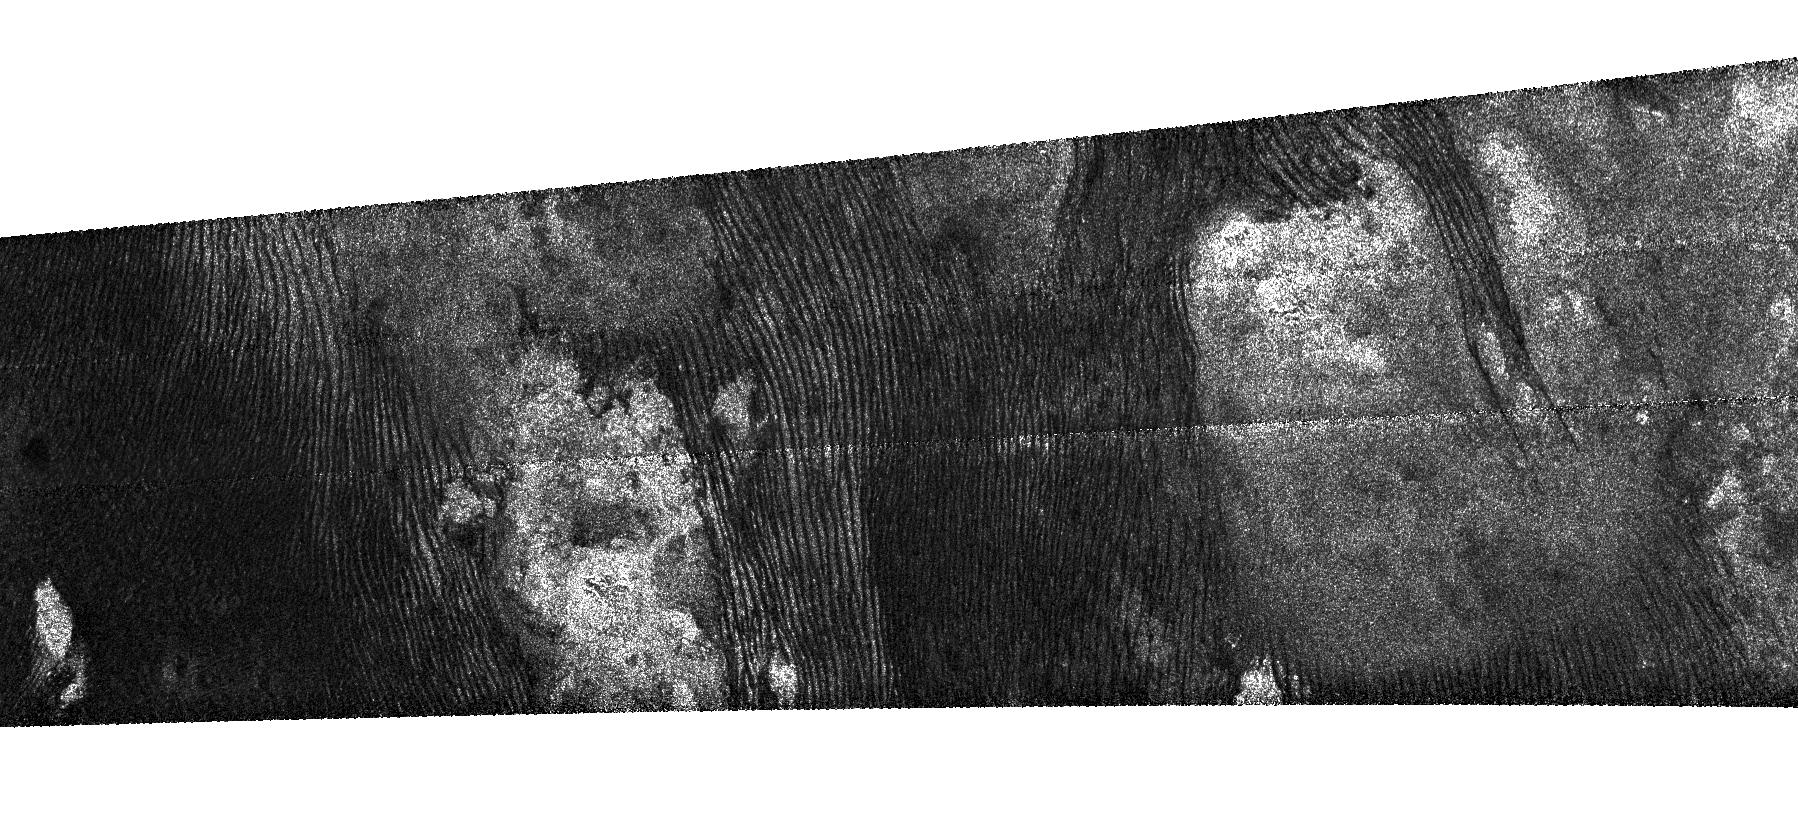 |
This radar image of Titan's equatorial
region and its sand dune features was obtained by the radar mapper
of the Cassini spacecraft on May 21, 2009 from an altitude of 965
kilometers ( around
600 miles
). The geographical portion is 225 kilometers wide ( 140 miles )
and 636 kilometers long ( 395 miles ), centered just north of the
equator
at 0.5 degrees north latitude and 154.2 degrees west longitude. North
appears to the right in this view and radar illumination comes from
the top at an incidence angle of 24 degrees. Image source: NASA / JPL |
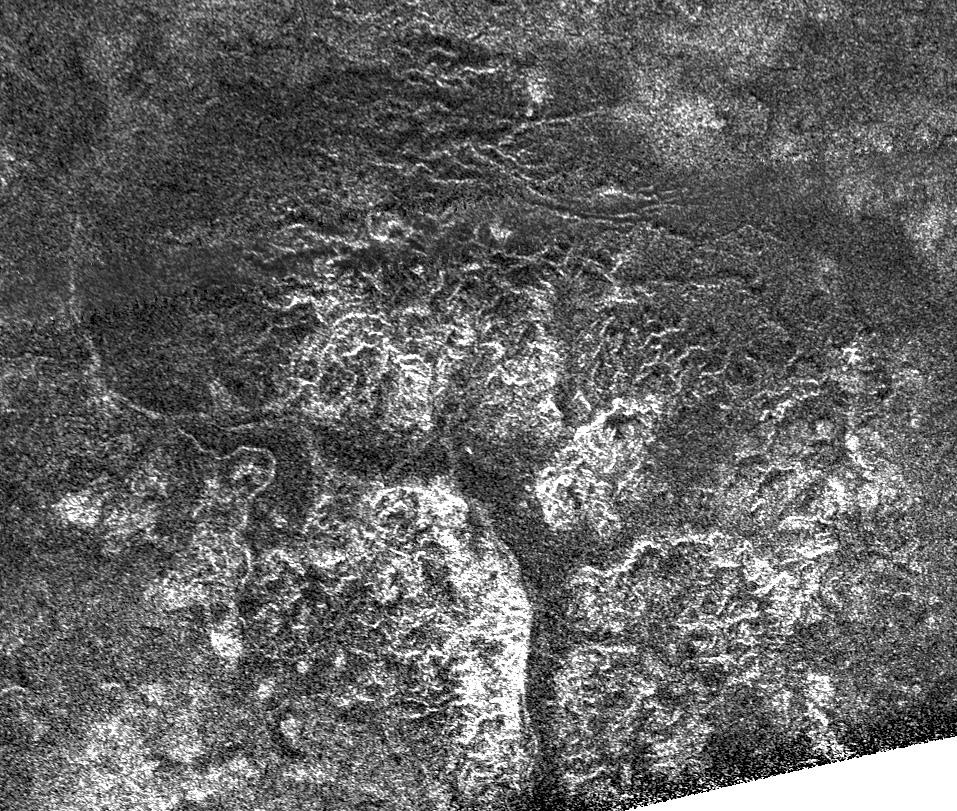 |
This radar image obtained by the
radar mapper of the Cassini probe on May 21, 2009 shows complex and
unique canyon systems in the high latitudes of Titan's southern hemisphere.
The view is centered at 71 degrees south latitude and 240 degrees west
longitude. This geographic portion is 335 kilometers long ( 208 miles
) and 289 kilometers wide ( 179 miles ). The region was illuminated
from the top of the view at 18 degrees incidence angle. Image source: NASA / JPL |
 |
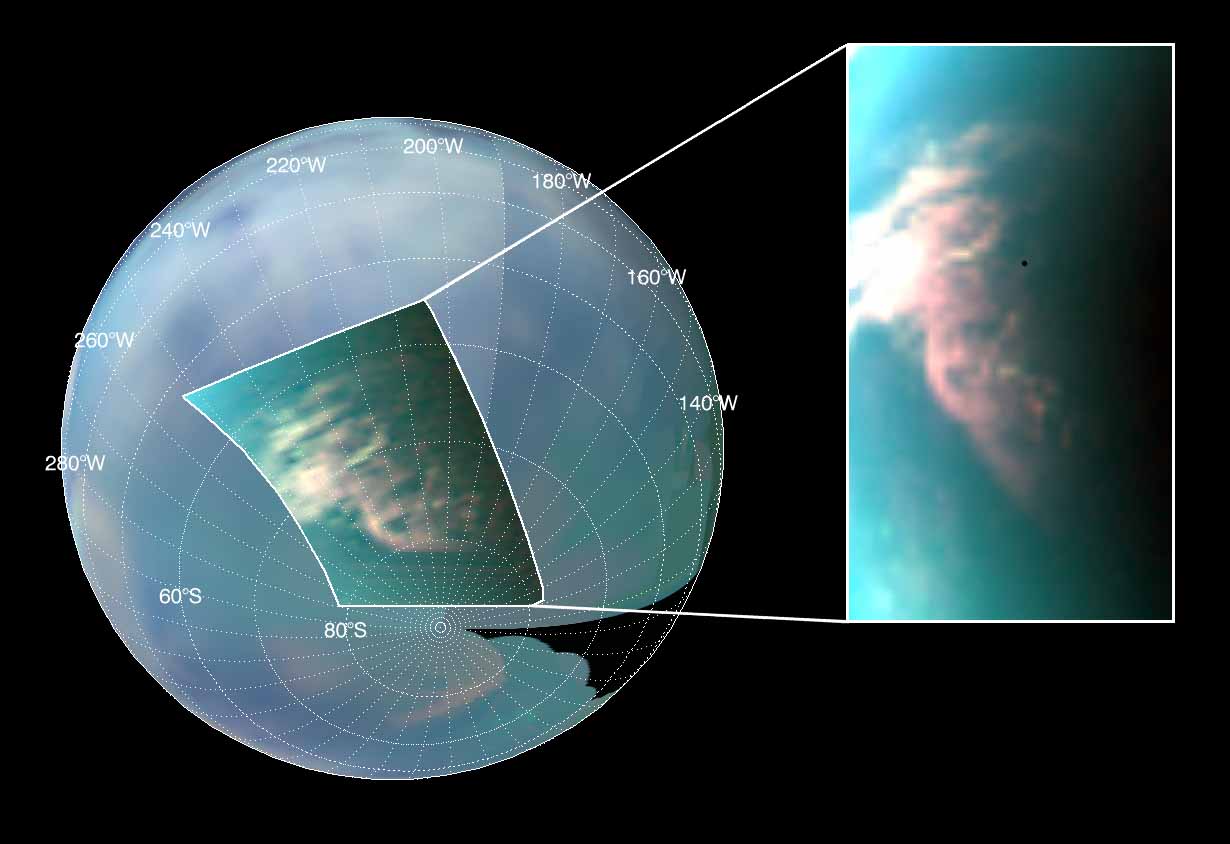 |
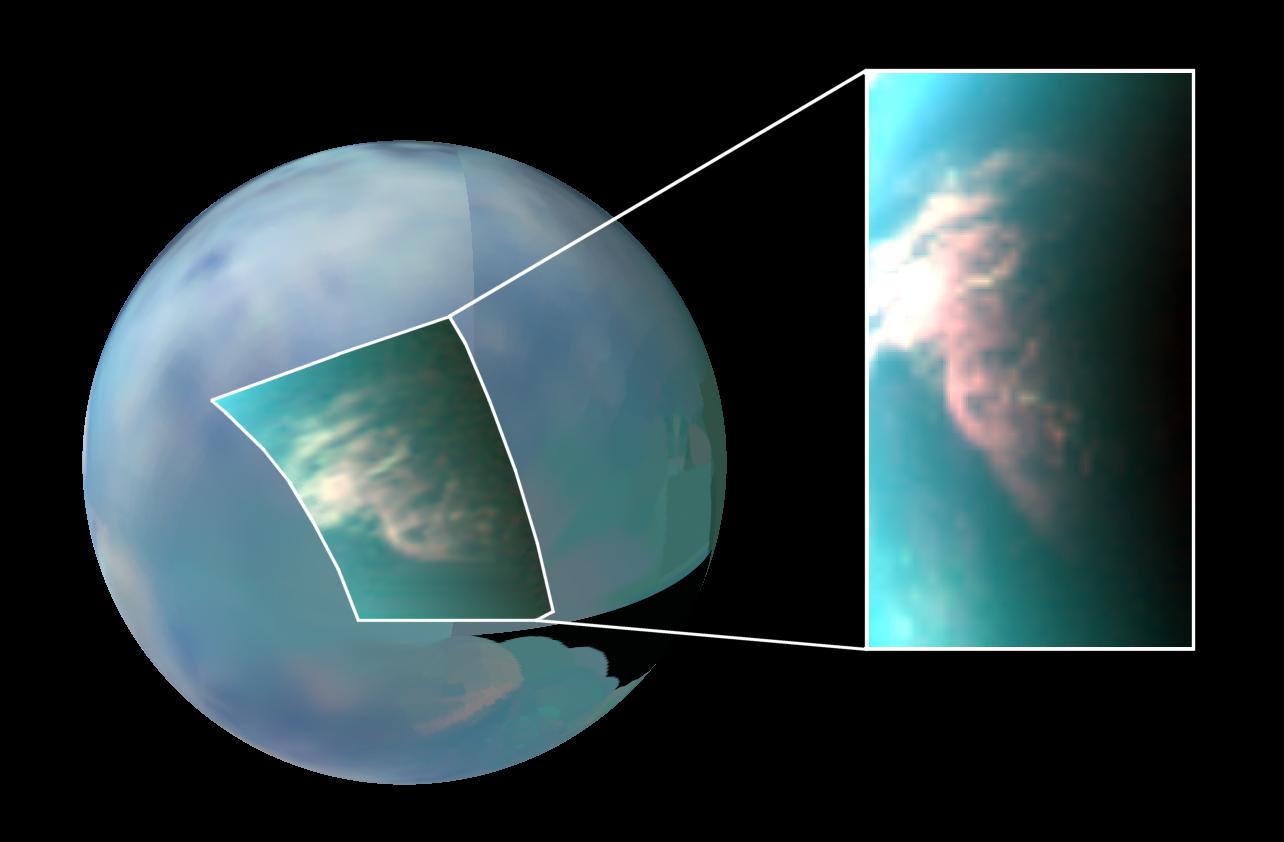
This global view of Saturn's largest
moon Titan is a color composite revealing large cloud formations in
the high latitudes of Titan's southern hemisphere. Cloud features are
discerned in the infrared spectrum. The views were obtained by Cassini's
Visual and Infrared Mapping Spectrometer during the T27 flyby of the
Orange Moon on March 26, 2007. The inset which is zoomed in on the
right of the disk shows the large cloud burst of clouds incorporating
red shown at a 5-micron wavelength, green at 2.7 microns, and blue
at 2 microns. The rest of the disk represents an infrared color mosaic
made of red at 5 microns, green at 2 microns and blue at 1.3 microns. Image source: NASA / JPL / University of Arizona / University of Nantes |
 |
 |
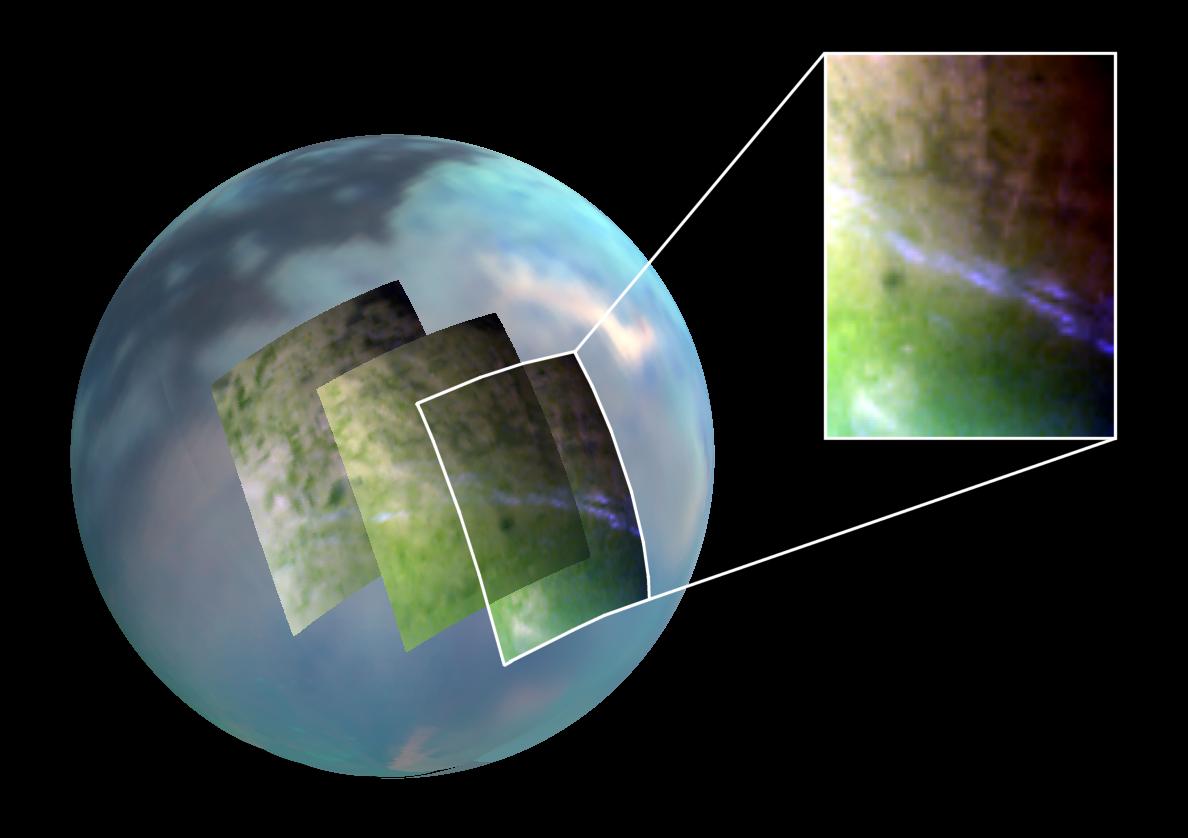
This mosaic of false-color views
of Titan reveals a multitude of elongated cloud formations between
40 degrees south latitude and 50 degrees south latitude. The color
frames were obtained by Cassini's Visual and Infrared Mapping Spectrometer
during a close flyby ( called the T17 Flyby) of the Orange Moon on
September 7, 2006. Each frame is a color composite made of red shown
at the 2-micron wavelength, green shown at 1.6 microns, and blue shown
at 2.8 microns. The rest of the globe surrounding the three frames
is represented with an infrared color mosaic made of red at 5 microns
, green at 2 microns and blue at 1.3 microns. Image source: NASA / JPL / University of Arizona / University of Nantes |
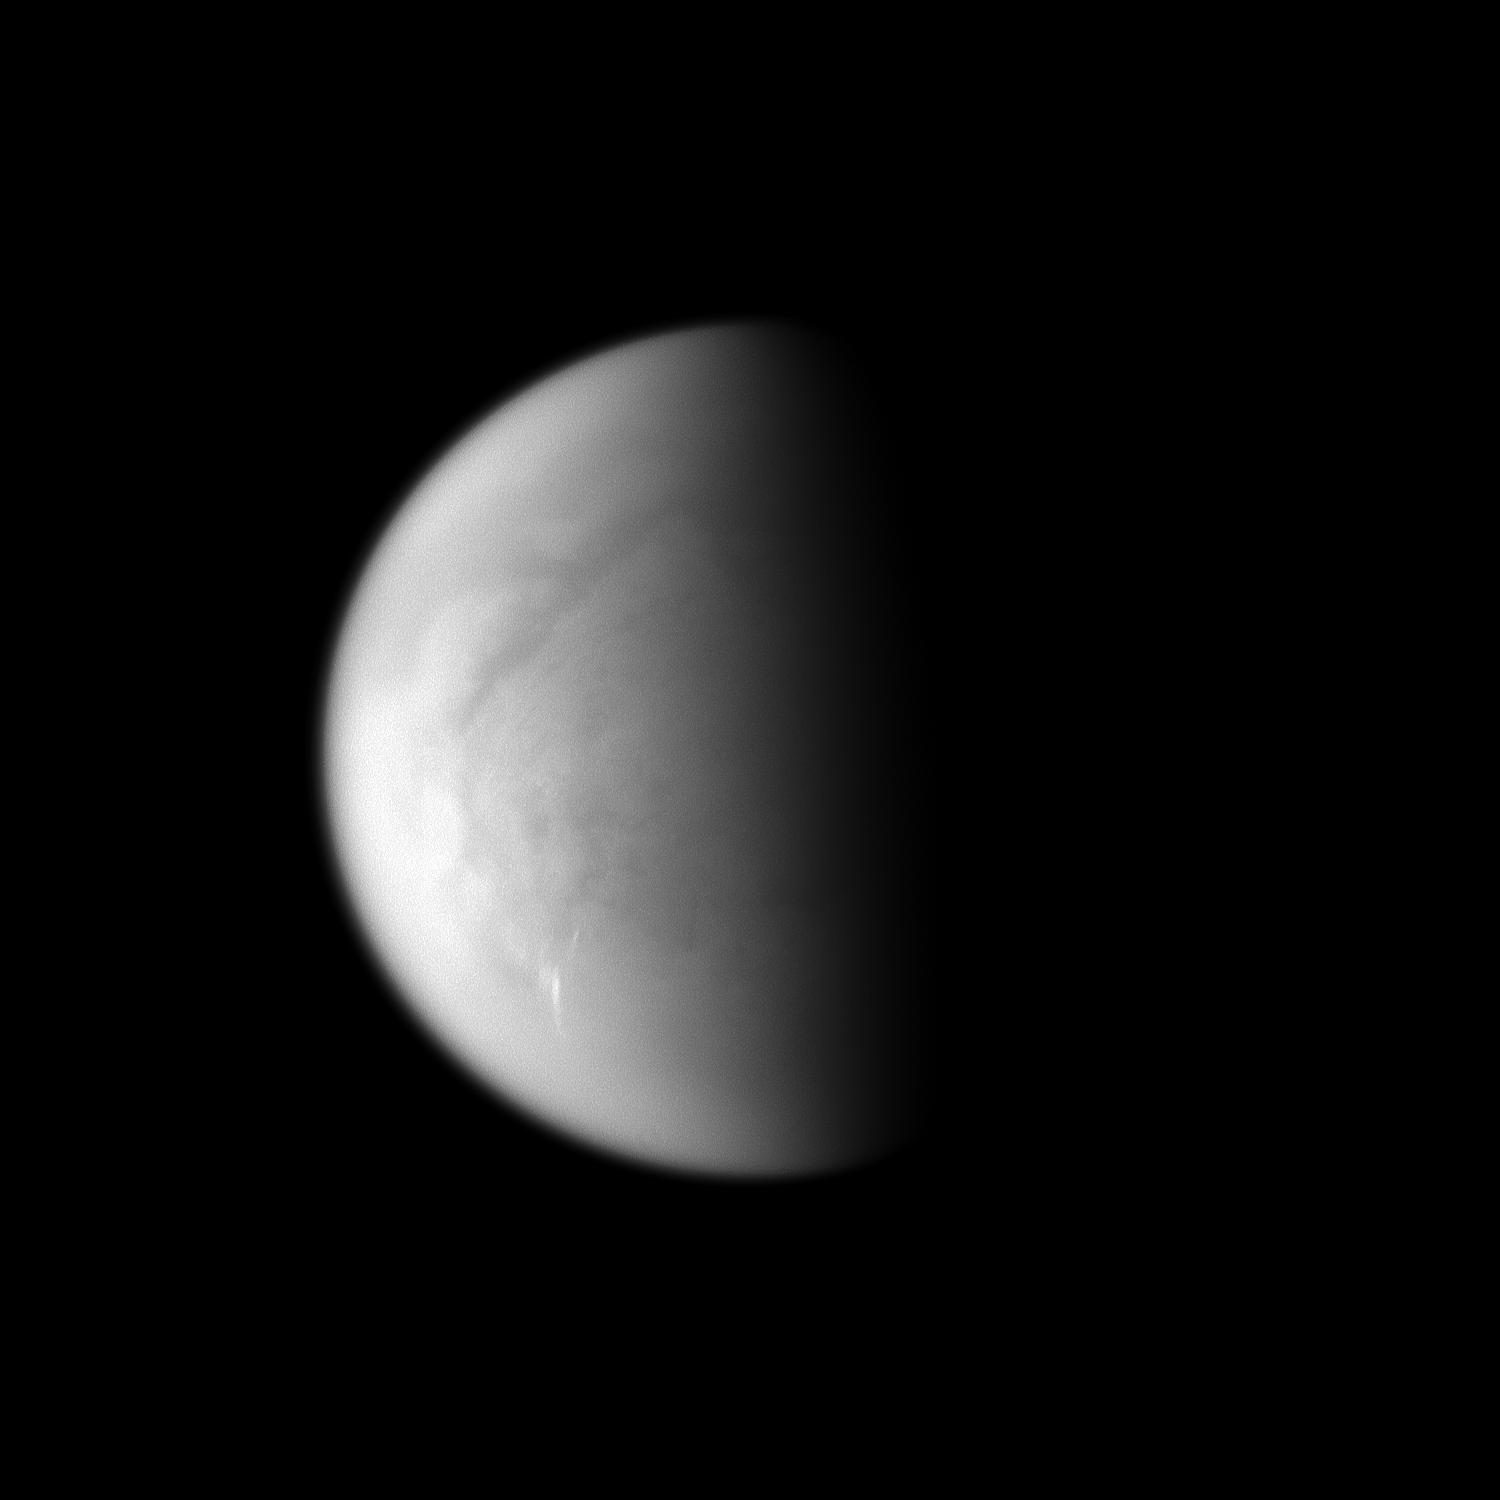 |
This near-infrared view of Saturn's
largest moon, Titan, reveals some cirrus-like cloud formations at mid-latitudes
in the southern hemisphere. The view was captured with the ISS ( Imaging
Science Subsystem ) narrow-angle camera of the Cassini probe on March
24, 2009 using a spectral filter sensitive to wavelengths of near-infrared
light centered at 938 nanometers. The image was acquired at a distance
of about 1.1 million kilometers (684,000 miles) from the Orange Moon
and at a Sun-Titan-spacecraft, or phase, angle of 78 degrees. The illuminated
terrain, here, appears on the leading hemisphere of Titan. Image source: NASA / JPL / Space Science Institute |
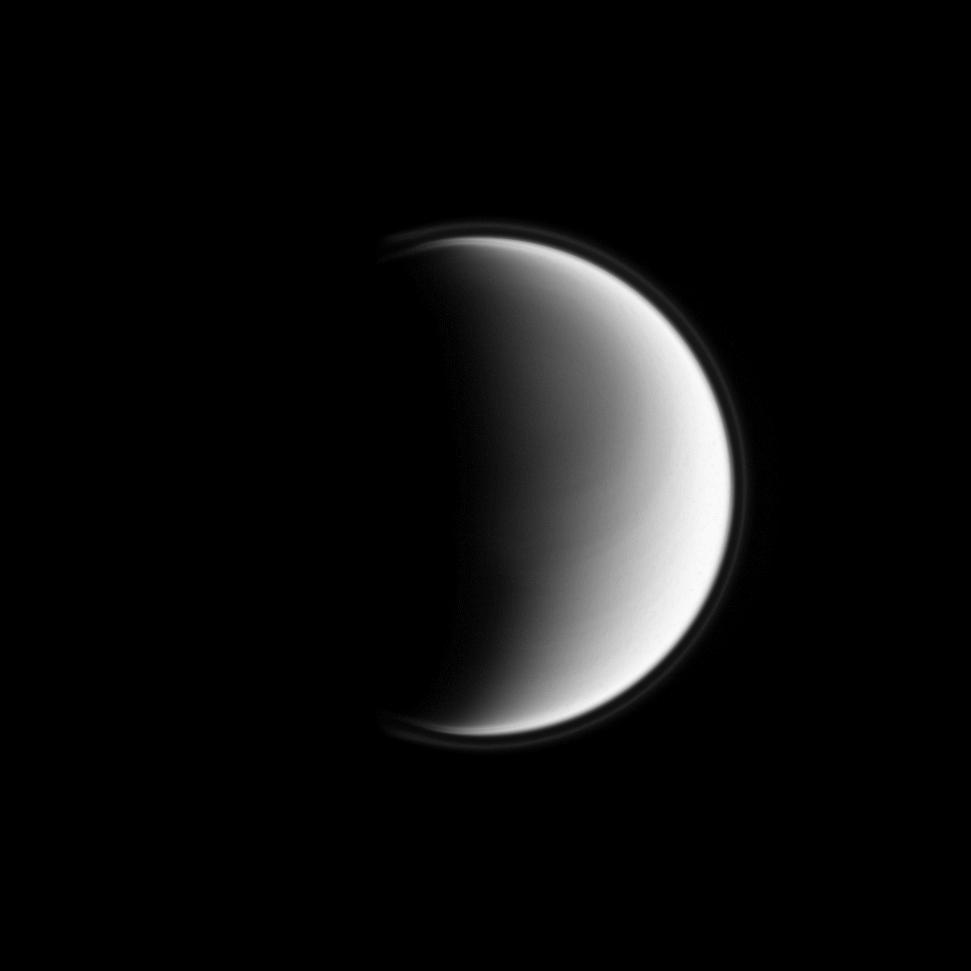 |
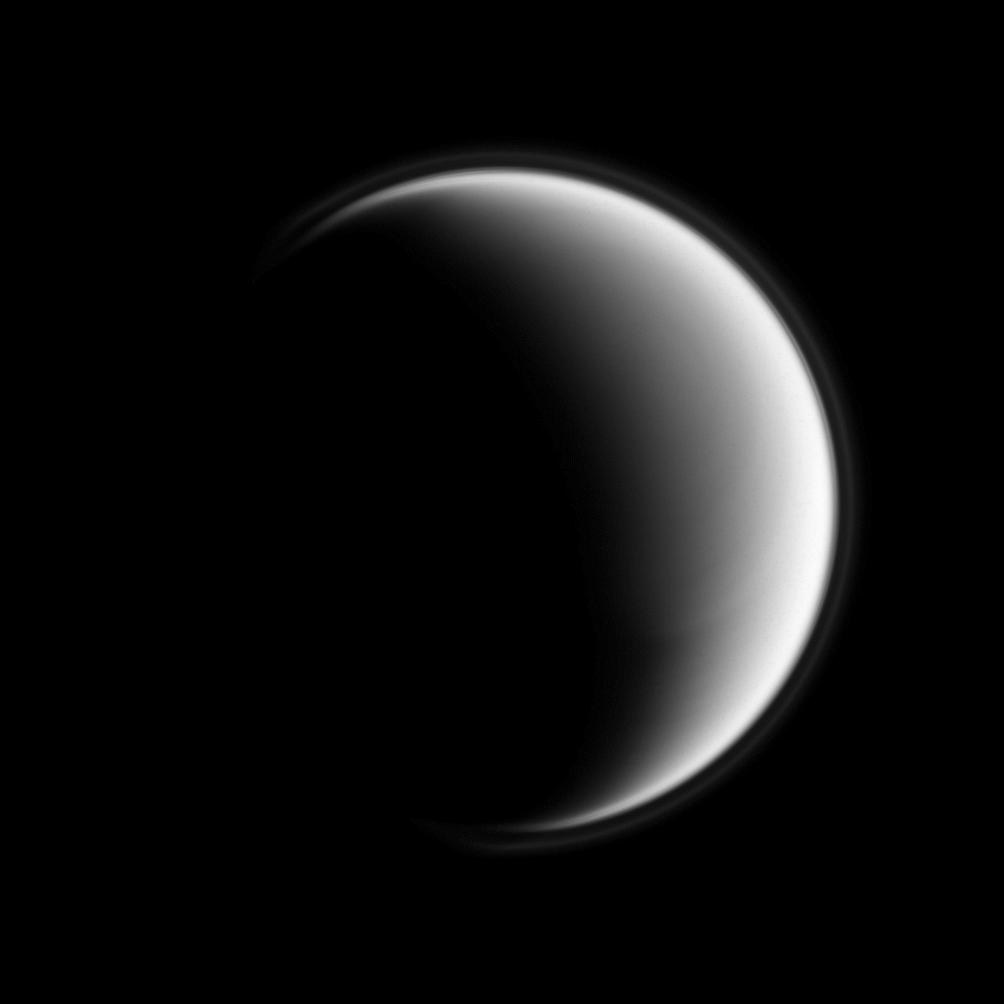
This view of Saturn's largest moon,
Titan, reveals the complexity of its deep and opaque atmosphere. This
crescent was obtained in visible violet light with the ISS wide-angle
camera from the Cassini probe on March 27, 2009. The image was taken
at a distance of about 196,000 kilometers ( 122,000 miles ) from the
Orange Moon and at a Sun-Titan-spacecraft, or phase, angle of 106 degrees.
The largest part of the lit terrain observed here is on the anti-Saturn
side of Titan. The north pole of the satellite is unveiled, surrounded
by several parallel atmospheric bands in the high northern latitudes:
in fact, it is located near the terminator approximately a quarter
of the way inward from moon's limb in the upper part of the view. Image source: NASA / JPL / Space Science Institute |
 |
This near-infrared view of Titan's
disk shows the Saturn-facing hemisphere of the moon and a large portion
of the south polar region. North appears up and is inclined by 27 degrees
to the right. This global view from the Cassini spacecraft was obtained
with the narrow-angle camera of the Imaging Science Subsystem ( ISS
) on February 15, 2009 using a spectral filter sensitive to wavelengths
of near-infrared radiation centered at 938 nanometers. The image was
captured at a distance of about 1.2 million kilometers ( 746,000 miles
) from Saturn's largest moon and at a Sun-Titan-spacecraft, or phase,
angle of 55 degrees. Image source: NASA / JPL / Space Science Institute |
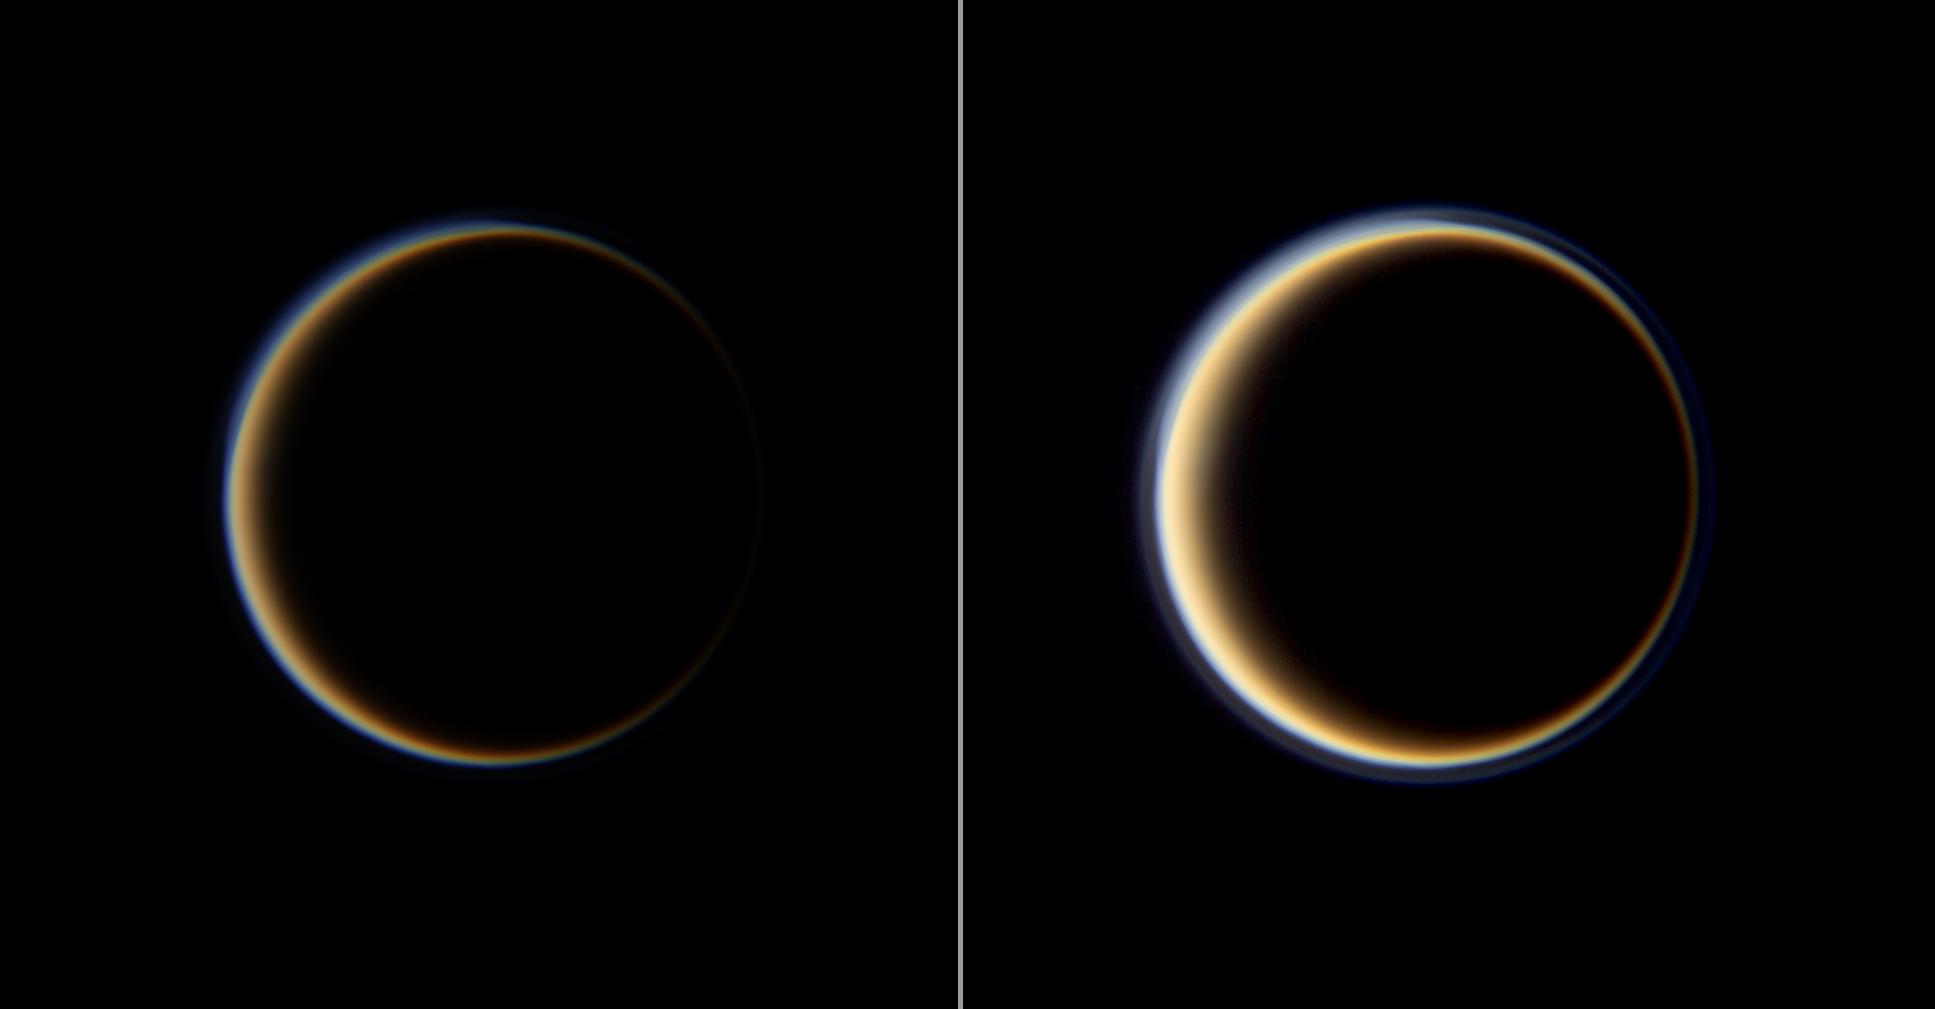 |
The outer shell of Titan's
atmosphere is clearly identified in these contrast-enhanced views
of the Saturn-facing side of the moon. North is orientated to the top
and is inclined at 45 degrees to the left. The full color views of
the orange satellite were obtained on the basis of images using
and combining red, green and blue spectral filters. The phase angle
or Sun-Titan-spacecraft angle is 157 degrees which is particularly
high. The views were captured at a distance of about 1.8 million kilometers
( 1.1 million miles ) from Saturn's largest moon. Image source: NASA / JPL / Space Science Institute |
 |
 |
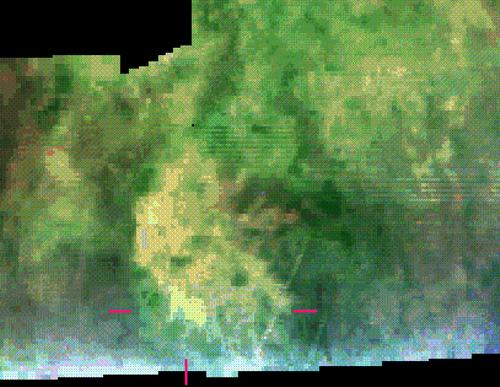 |
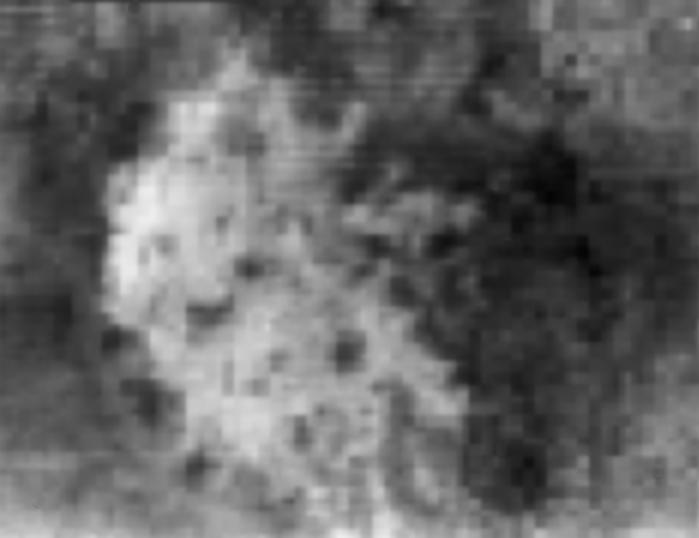
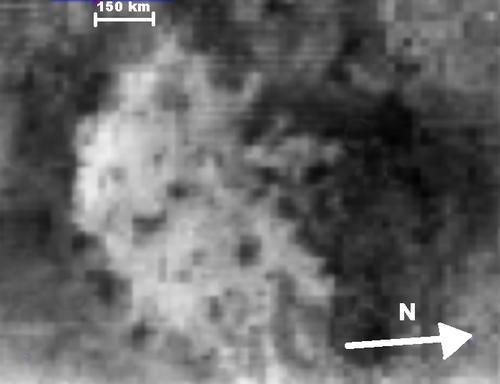
This set of infrared images shows
Hotei Arcus, a region of Titan's southern hemisphere suspected
to be volcanically active. The representations are based on the same
view. The top view corresponds to the view without annotations or markings.
The middle view indicates the geographic scale and the direction of
the north. The bottom view uses artificial colors and red markings
to delimitate a region that is chemically distinct from its surroundings,
pointing at a potentially, recent volcanic activity.
The infrared view was obtained by the Cassini's Visual And Infrared
Mapping Spectrometer ( VIMS ) on November 19, 2008 at a distance of
29,000 kilometers ( 18,000 miles ). Image source: NASA / JPL / University of Arizona |
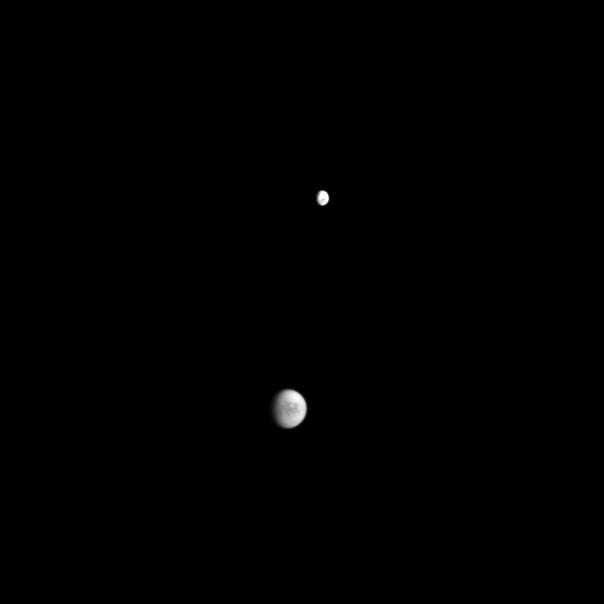 |
This near-infrared view showing
the Saturn moons Titan and Dione was obtained on January 28, 2009 with
the ISS wide-angle camera of the Cassini spacecraft. The image was
captured at a distance of about 2.3 million kilometers ( 1.4 million
miles ) from Titan with a Sun-Titan-spacecraft, or phase, angle of
44 degrees. It was taken using a spectral filter sensitive to wavelengths
of near-infrared
light
centered
at
939 nanometers. Titan is the globe in the lower part of the view. Its
geographic north is up and rotated 3 degrees to the left. The eye sees
the Saturn-facing side of Titan and the leading hemisphere of Dione. Image source: NASA / JPL / Space Science Institute |
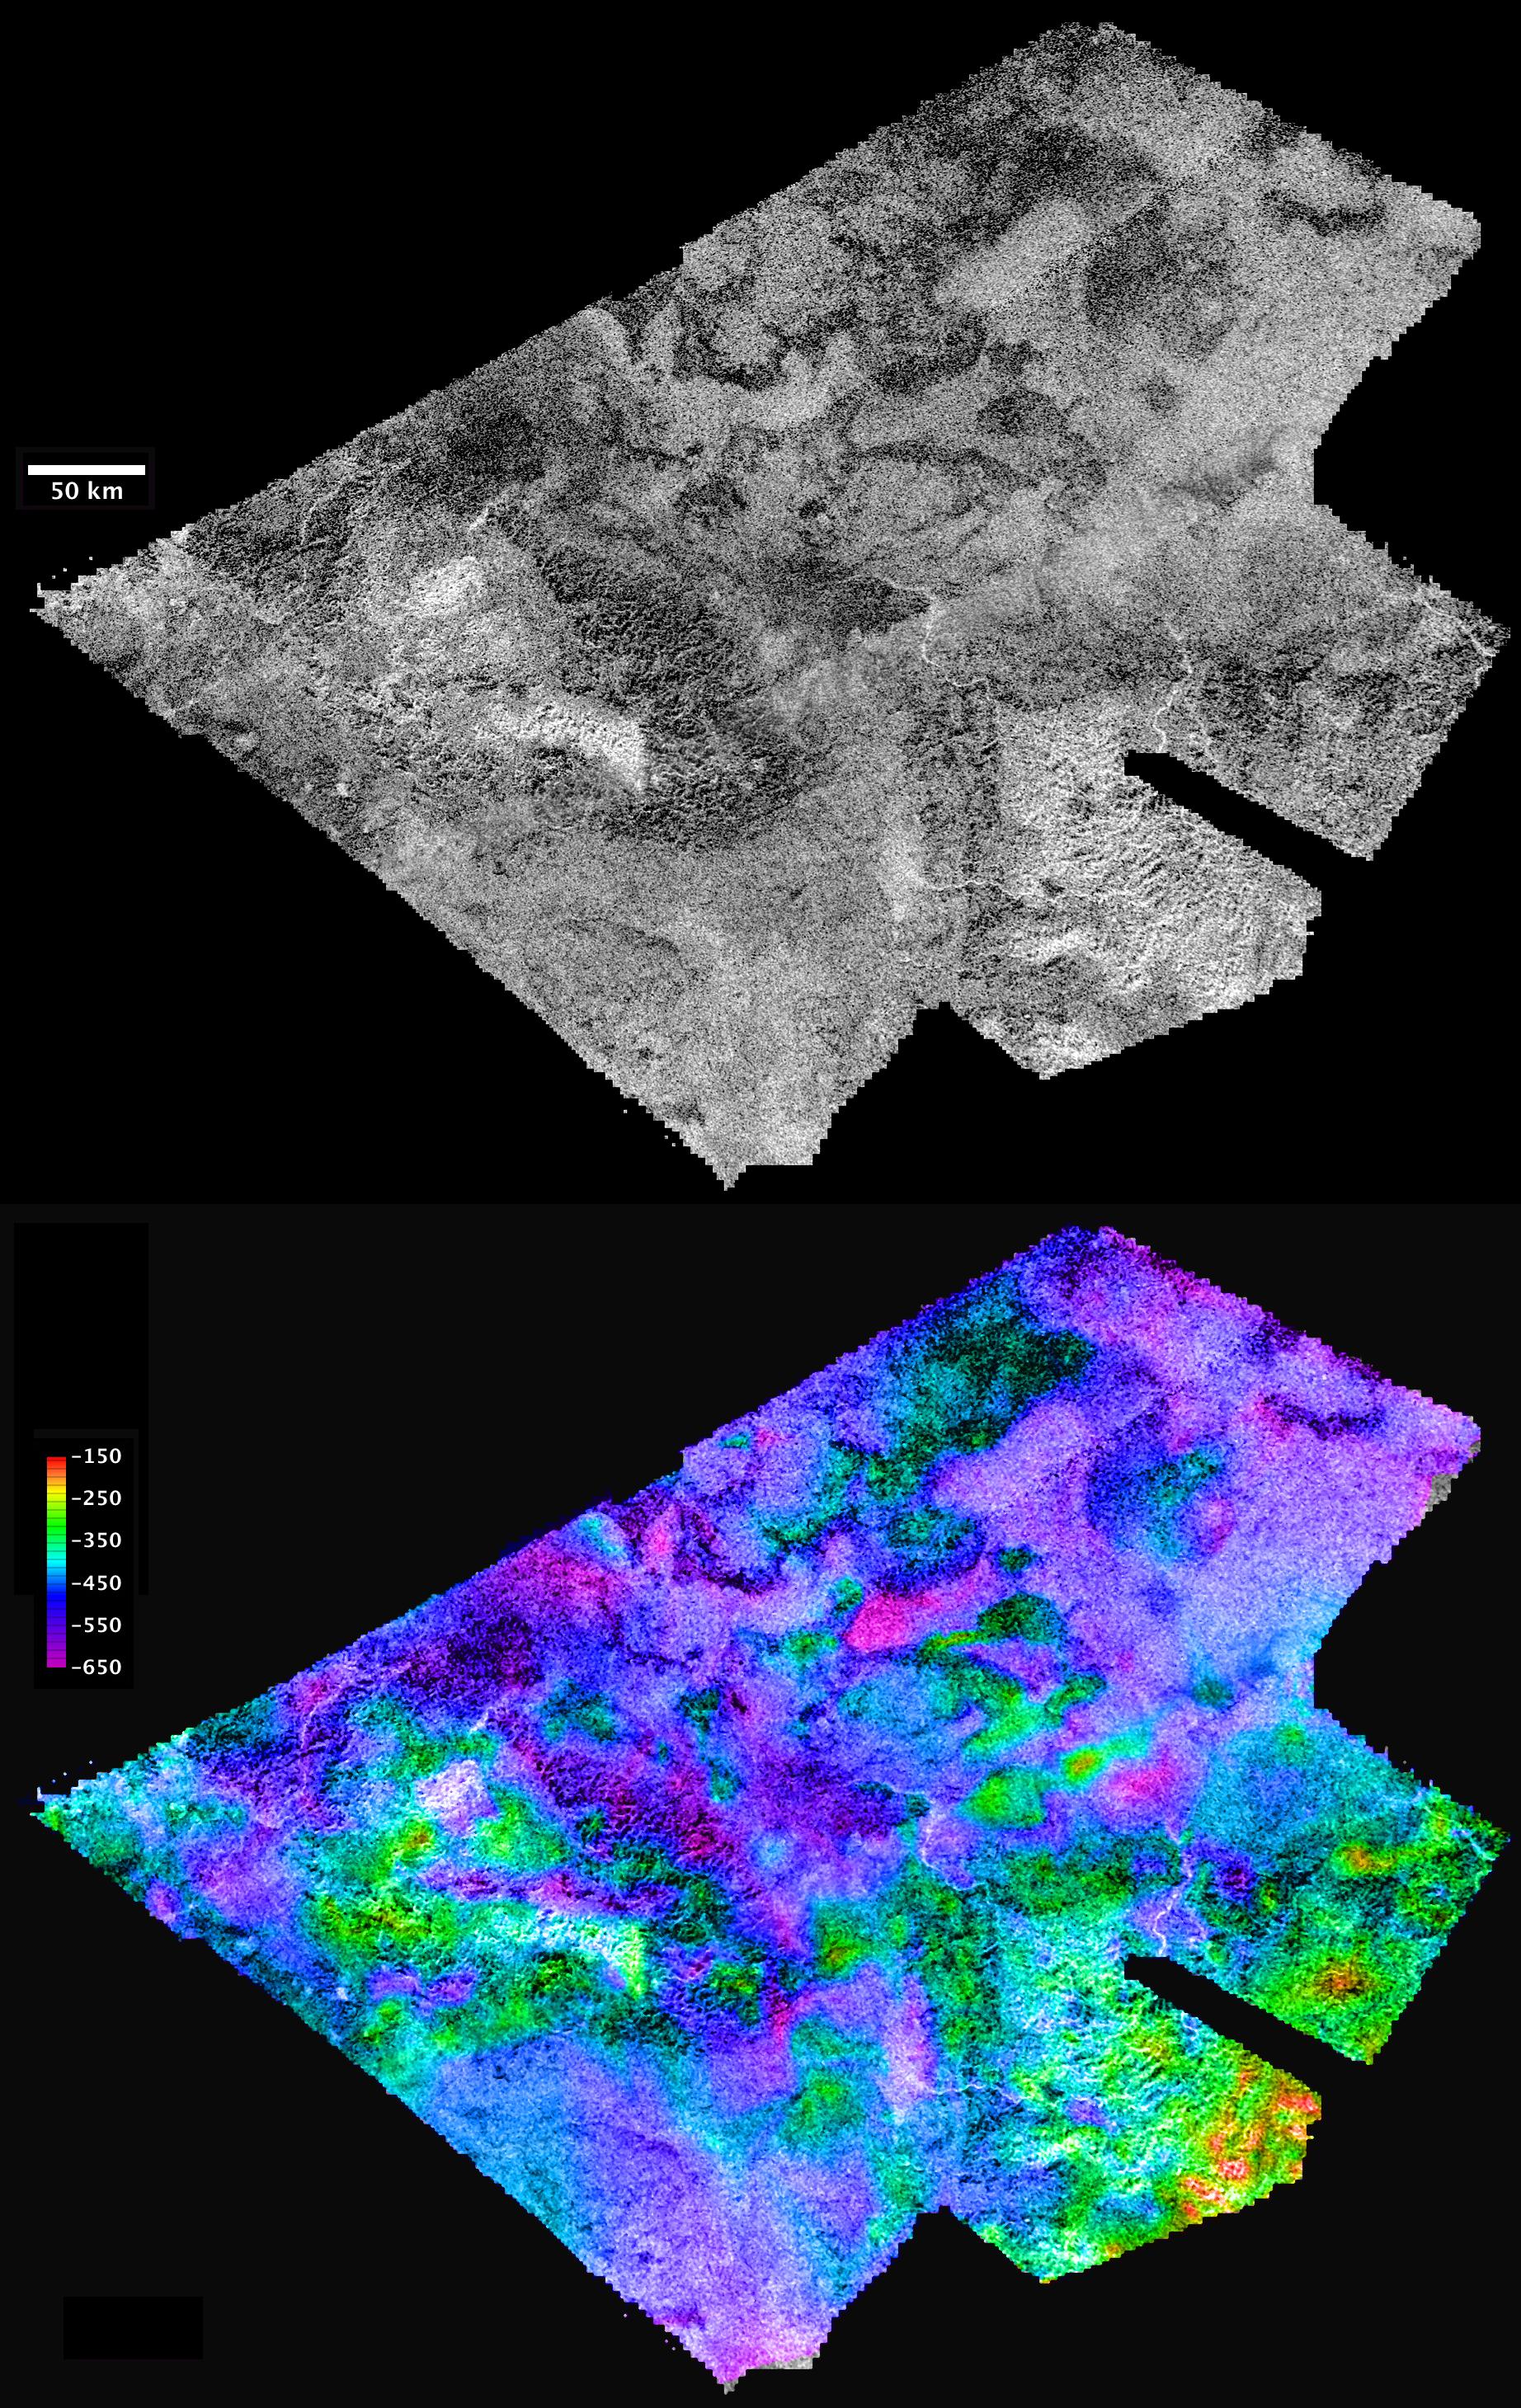 |
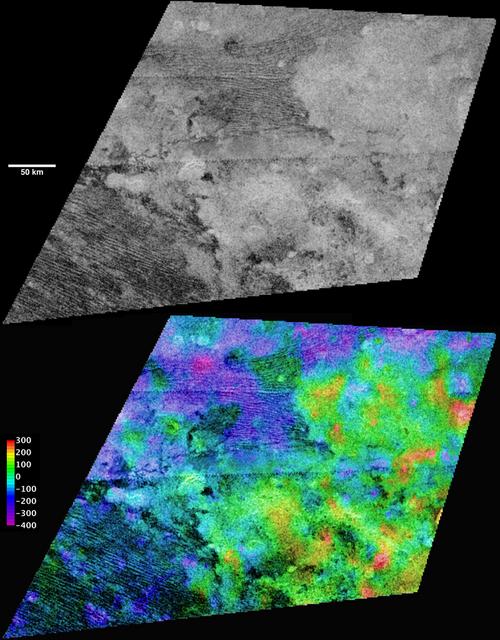
This composite image shows a portion
of the region of Hotei Arcus in the south east of the optically bright
Xanadu. The black and white view at the top corresponds to a radar
view of the area taken by the radar mapper of the Cassini spacecraft
during
the
T41 flyby on February 22, 2008. This radar image is converted
into a topographic map appearing with colors to reveal variations in
altitude as shown in the lower part of the image. 3D data was inferred
from two radar views of the same region during the T41 flyby on February
22, 2008 and the T43 flyby on May 12, 2008. The color bar at left provides
the scale of altitude from the lowest altitude of -650 meters associated
with the purple or violet color and the highest altitude of -150 meters
below zero elevation associated with the red color. One admits that
zero elevation is equal to a distance of 2,575 kilometers ( 1,600 miles
) from the center of Titan, which corresponds, approximately, to the
average radius of Saturn's largest moon. The maps are represented in
equirectangular projection with north to the top. Image source: NASA / JPL / USGS |
 |
This composite image presenting
intriguing landscape features in Titan's northern hemisphere
is based on radar data obtained by the radar mapper onboard the Cassini
spacecraft.
Stereo
views of
this radar strip were generated by using two radar images of the same
region captured during the Ta flyby on October 26, 2004 and the T23
flyby on January 13, 2007. Image source: NASA / JPL / USGS |
 |
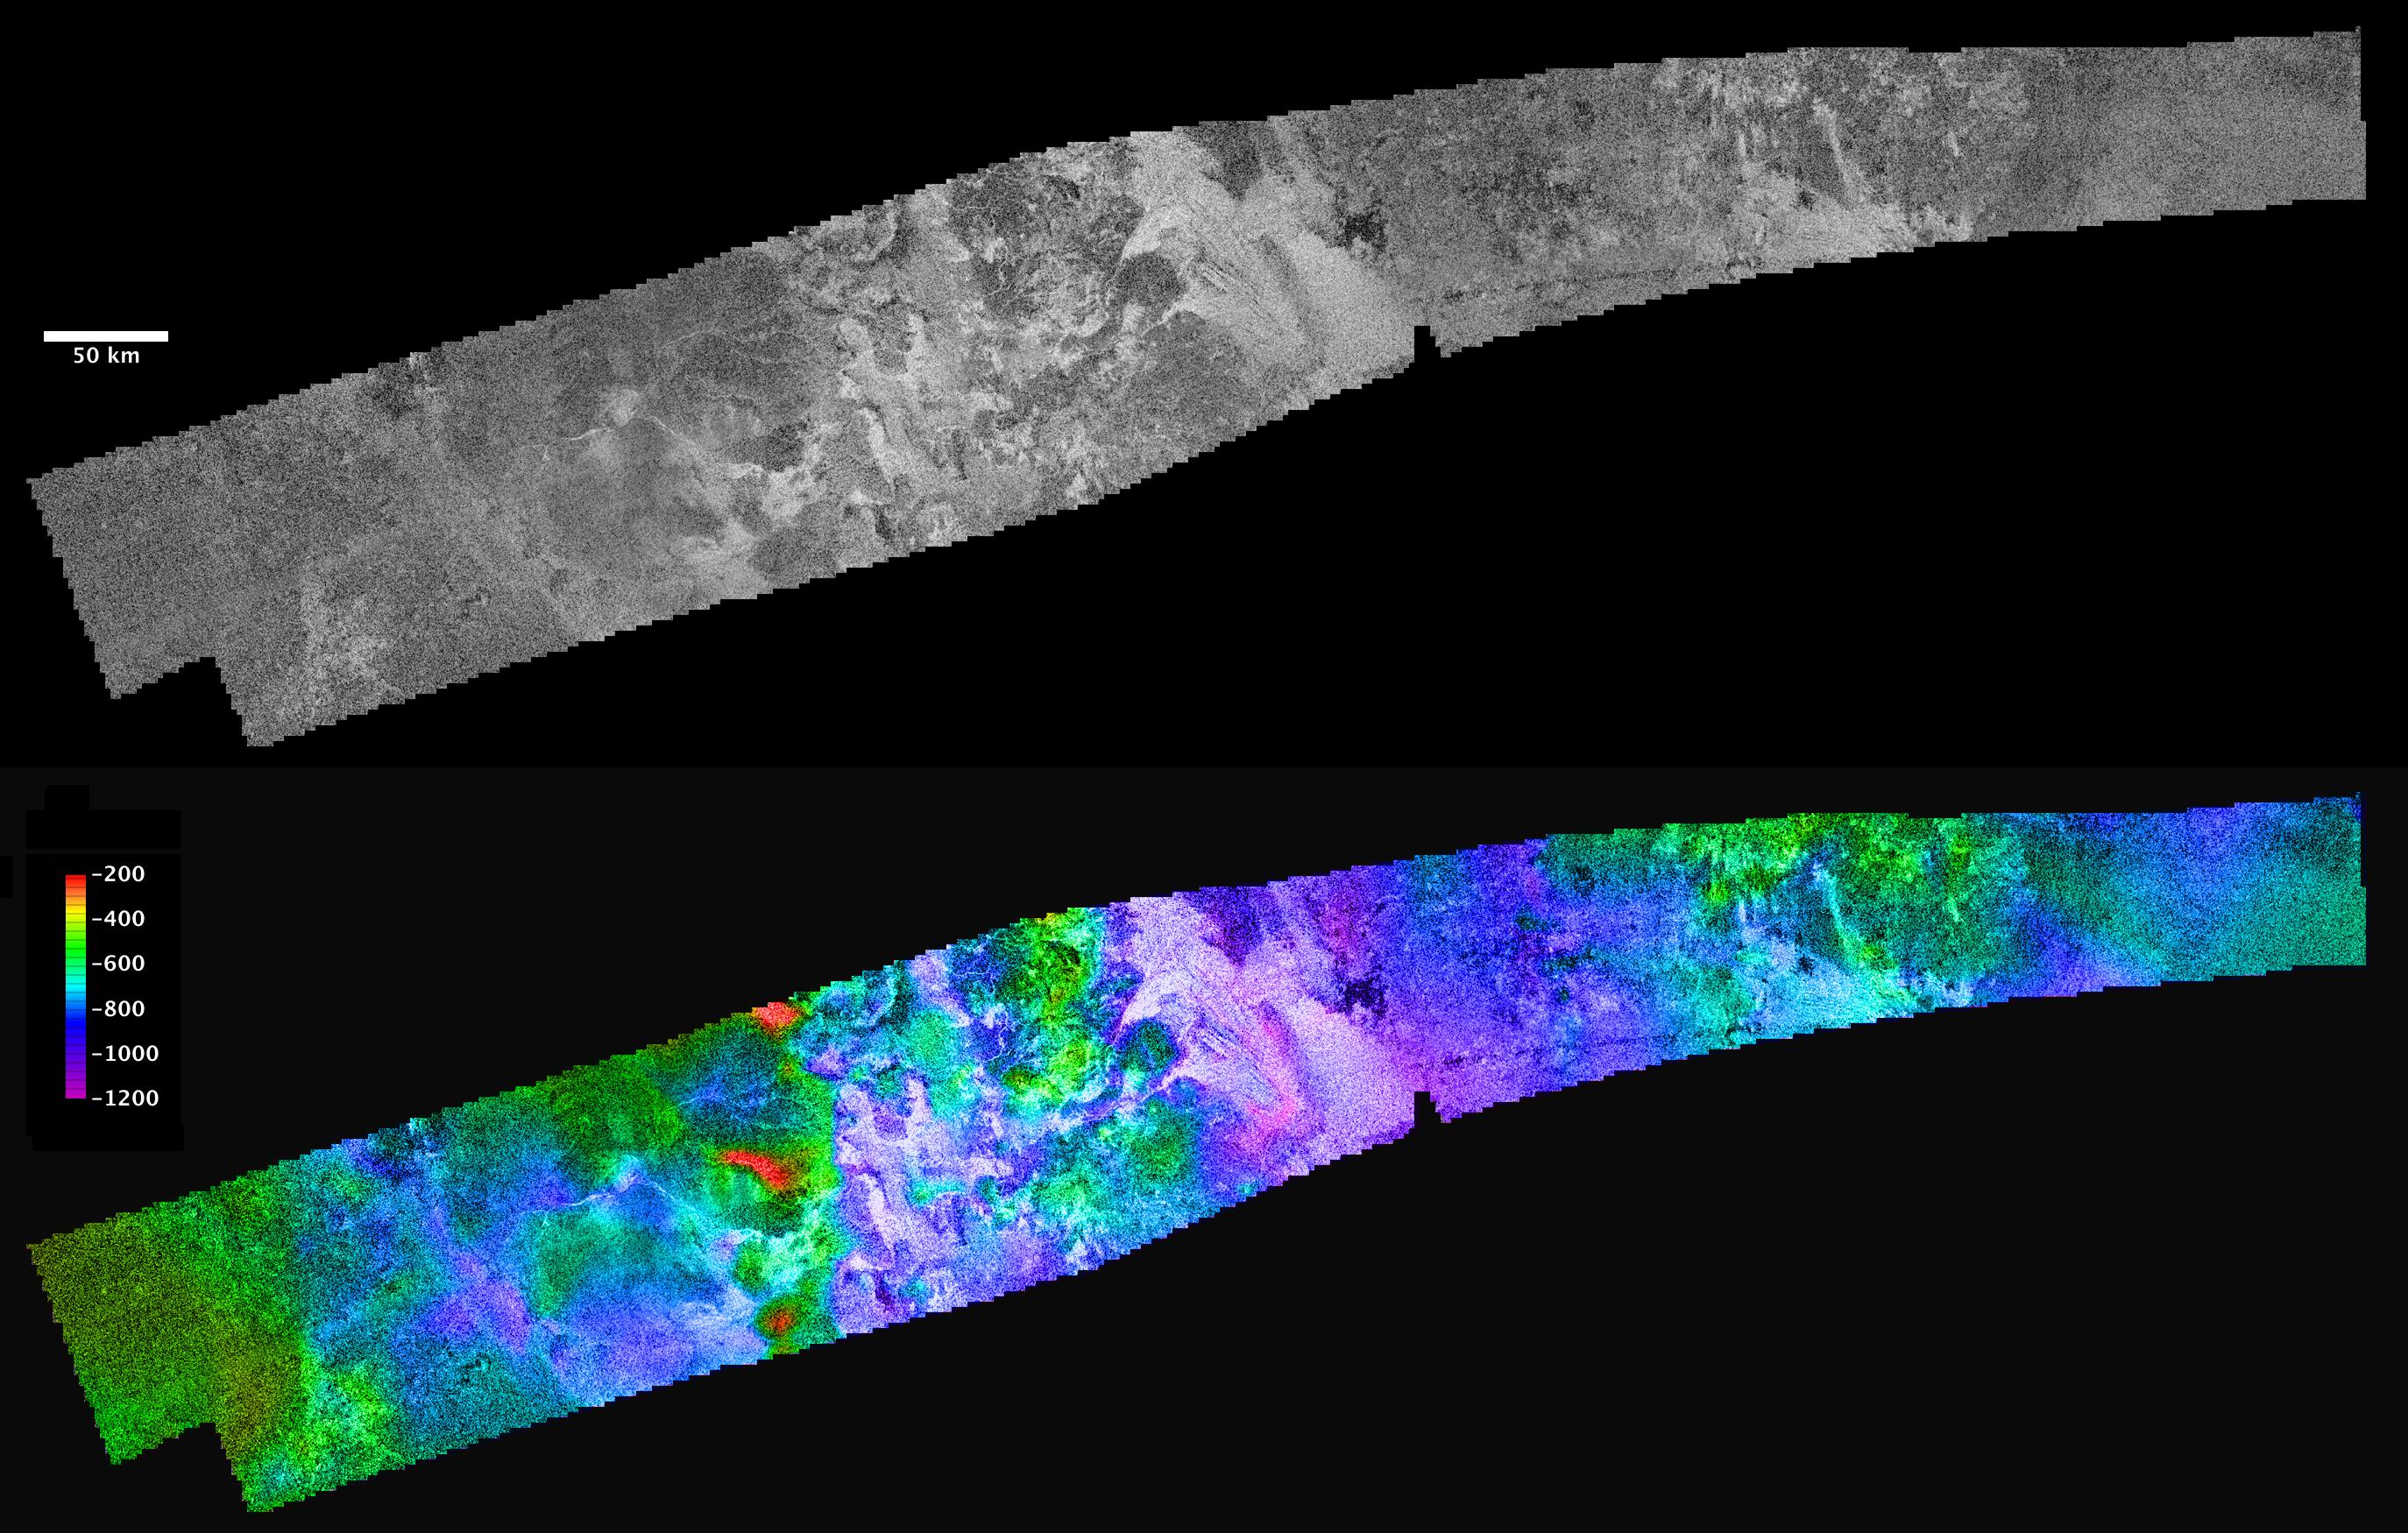
This set of radar images reveals
topographic features of the Belet region on Saturn's largest moon.
The lower view is the same view as the black and white view with
color coding to reveal elevations, as shown by the color bar at left.
The
black and white portion at the top corresponds to a view taken by
the Cassini spacecraft during the T8 flyby on October 28, 2005. The
area
is centered near 9 degrees south latitude, 290 degrees west longitude,
and is approximately 450 kilometers ( 280 miles ) across. The maps
are represented in equirectangular projection with north to the top. Image source: NASA / JPL / USGS |
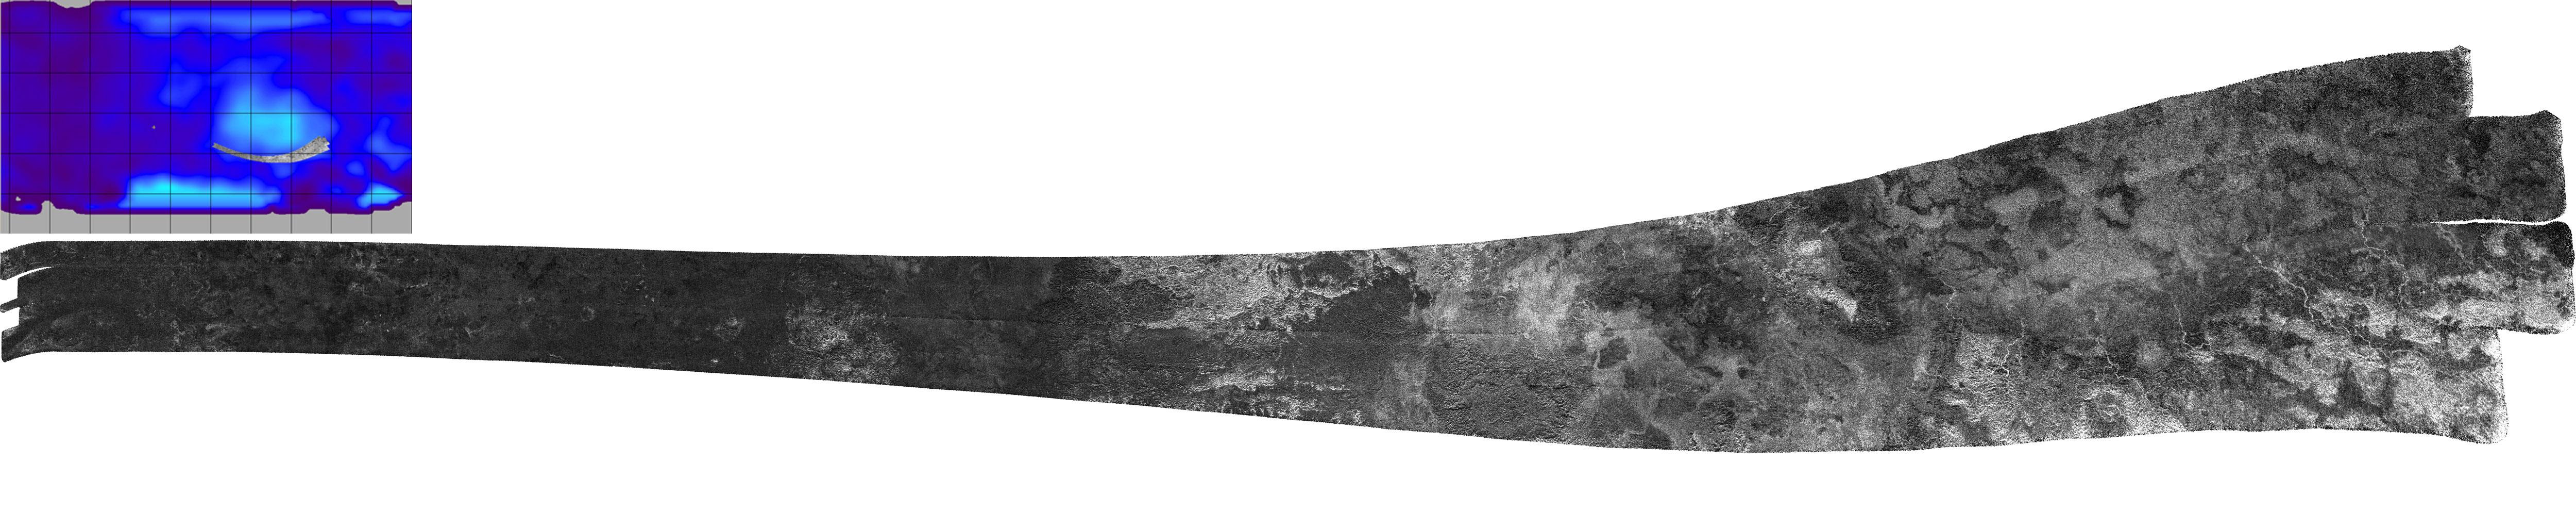 |
In this mosaic of images, the
southern boundary of the optically bright region Xanadu is represented.
The
radar swath was obtained by the radar mapper of the Cassini spacecraft
on February 22, 2008. The broad radar arc is approximately 3,450
kilometers long ( around 2,145 miles ) and the topography scanned
extends from
28 degrees south latitude, 150 degrees west longitude to 28 degrees
south latitude, 65 degrees west longitude. The width of the
radar portion , from top to bottom, ranges from 150 to 530 kilometers
(
approximately 95
to 330 miles ). Radar illumination comes from the south. On the upper
left of the mosaic, the blue and grey inset is a global map of Saturn's
largest moon which
shows
the
location
of
this
radar
swath. Image source: NASA, JPL |
 |
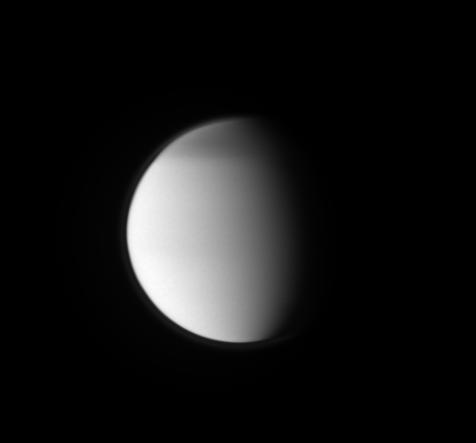
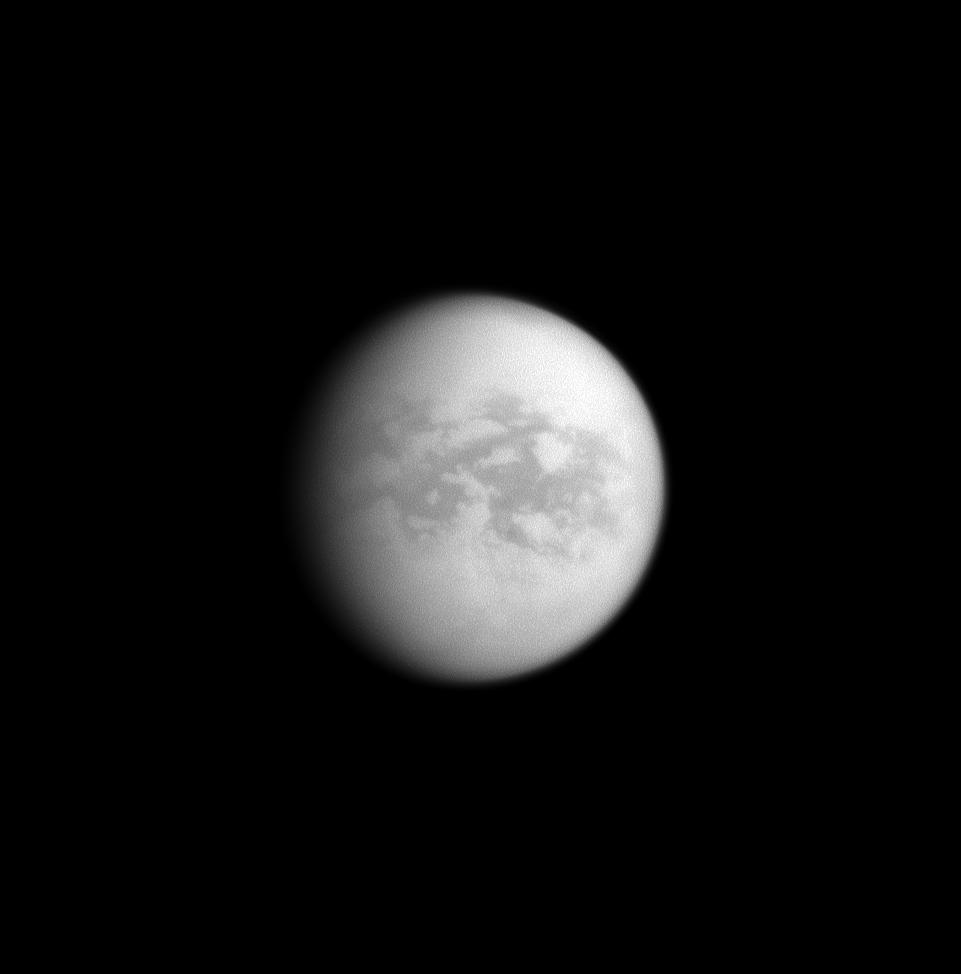
This view of Titan's disk which
represents the Saturn-facing hemisphere of the moon was captured by
the narrow-angle camera of the Cassini probe on January 30, 2009. North
is up and inclined 34 degrees to the left. The image was obtained at
a distance of about 2.3 million kilometers ( 1.4 million miles ) from
Titan, using a spectral filter sensitive to wavelengths of near-infrared
light centered
at 938 nanometers. The image was captured with a low phase angle: the
camera acquired this view with a Sun-Titan-spacecraft, or phase, angle
of only 26 degrees. As a result, nearly the entire disk of Saturn's
largest moon is illuminated by the Sun, with the star appearing behind
the Cassini spacecraft. Image source: NASA, JPL, Space Science Institute |
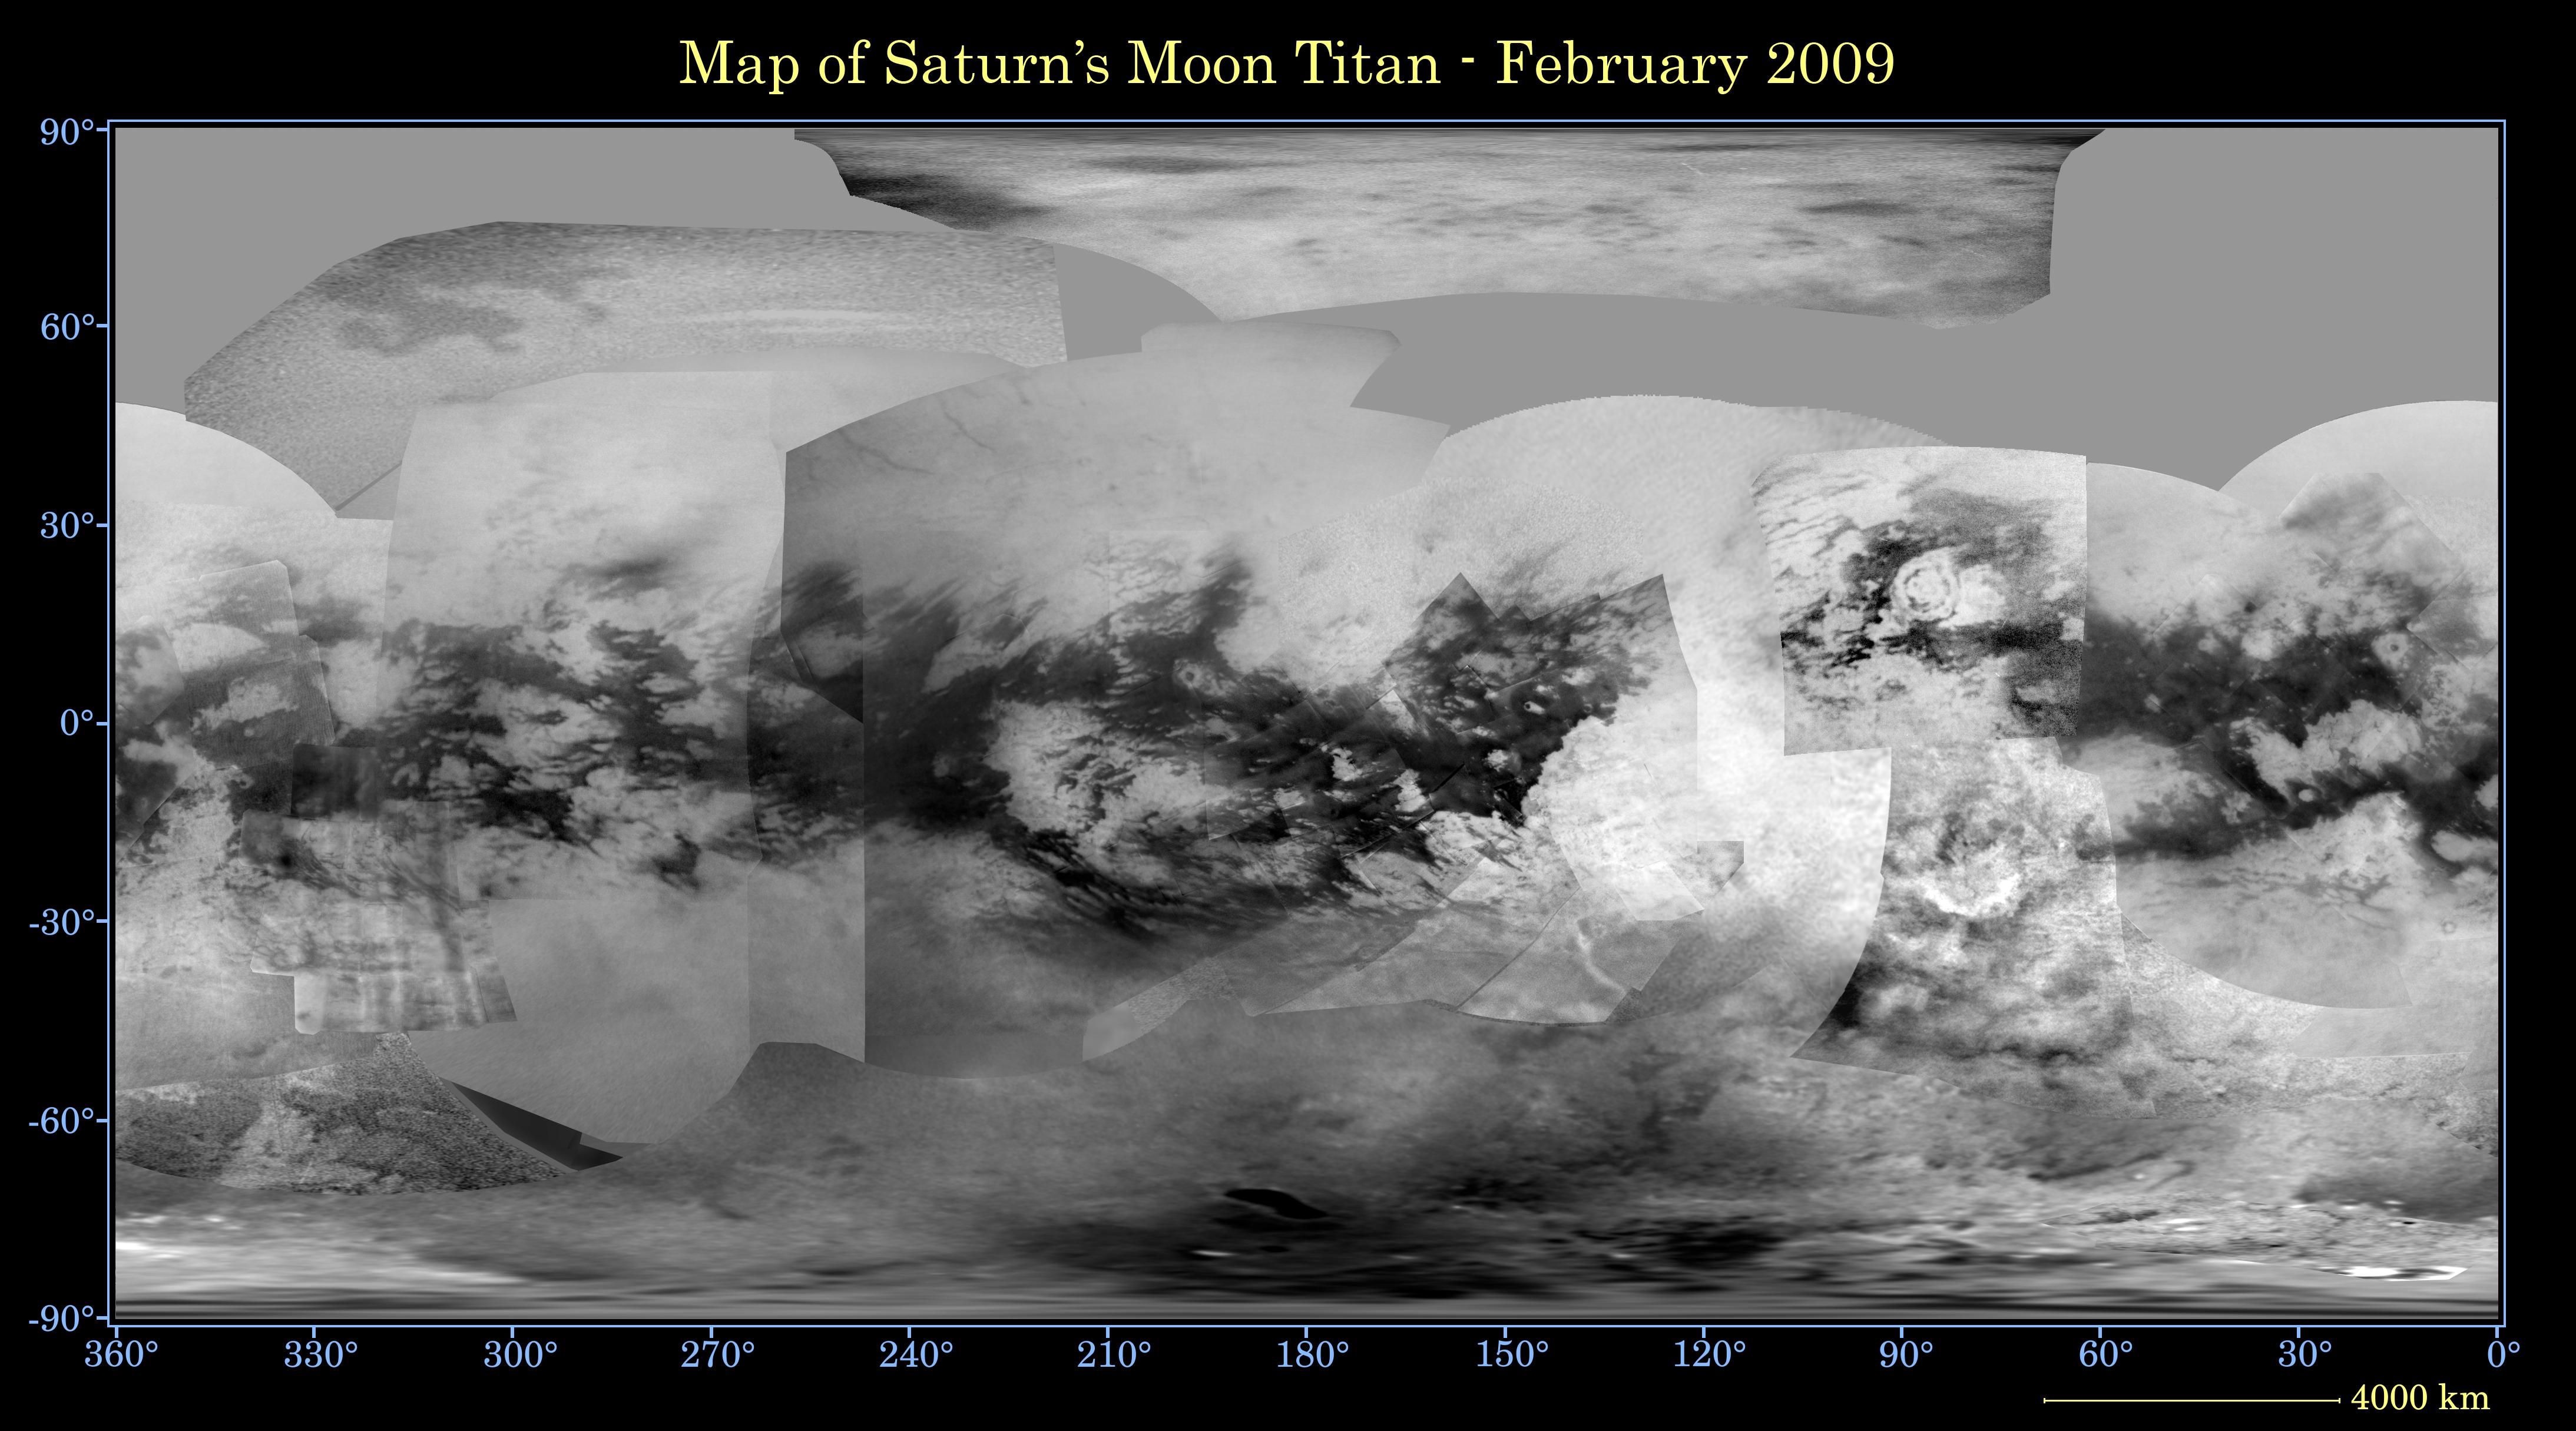 |
This updated map of Saturn's largest
moon Titan was generated using infrared or near-infrared views captured
by the imaging science subsystem ( ISS ) aboard the Cassini spacecraft.
The views were obtained using a spectral filter centered at 938 nanometers.
The global digital map is an equidistant projection and has a scale
of 4 kilometers ( 2.5 miles ) per pixel. The map is still incomplete
and the actual resolution is better near the center and edges of
the map. The worst coverage turns out to be on the leading hemisphere
centered around 120 degrees west longitude. Image source: NASA, JPL |
 |
This radar view of Titan was obtained
by the radar mapper of the Cassini probe during the flyby of
December 21, 2008. The portion shown is centered near 19.2 degrees
south and 257.4 degrees west. The covered area is 220 kilometers long
( 137 miles ) and 170 kilometers wide ( 106 miles ) and north is approximately
found toward the upper part of the image. The radar illumination comes
from the right and the incidence angle is roughly 25 degrees. Image source: NASA, JPL |
 |
This global map of Saturn's largest
moon, Titan, reveals the orientation of prevailing winds indicated
by white arrows. The base map, appearing in false color, uses infrared
or near-infrared views obtained from the imaging science subsystem
( ISS ) aboard the Cassini spacecraft. The direction or the orientation
of dominating winds was inferred from data captured by the Cassini
radar mapper and collected over a four-year period. Image source: NASA, JPL |
 |
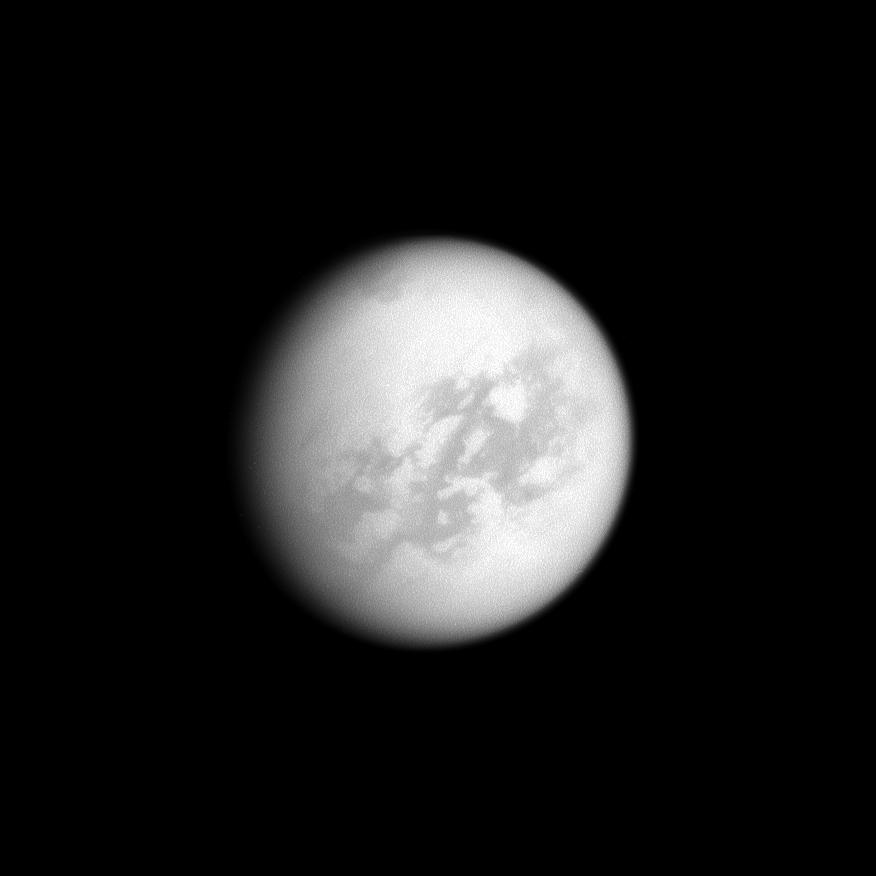
This infrared view of Titan was
acquired from the Cassini probe with the ISS narrow-angle camera on
January 2, 2009 using a spectral filter sensitive to wavelengths of
near-infrared light centered at 938 nanometers. The image was captured
at a distance of about 1.7 million kilometers or 1.1 million miles
from Titan, and at a Sun-Titan-spacecraft, or phase, angle of 54 degrees.
North is up and inclined at an angle of 24 degrees to the right. The
shot looks toward the Saturn-facing hemisphere of Saturn's largest
moon. Image source: NASA, JPL |
|
|
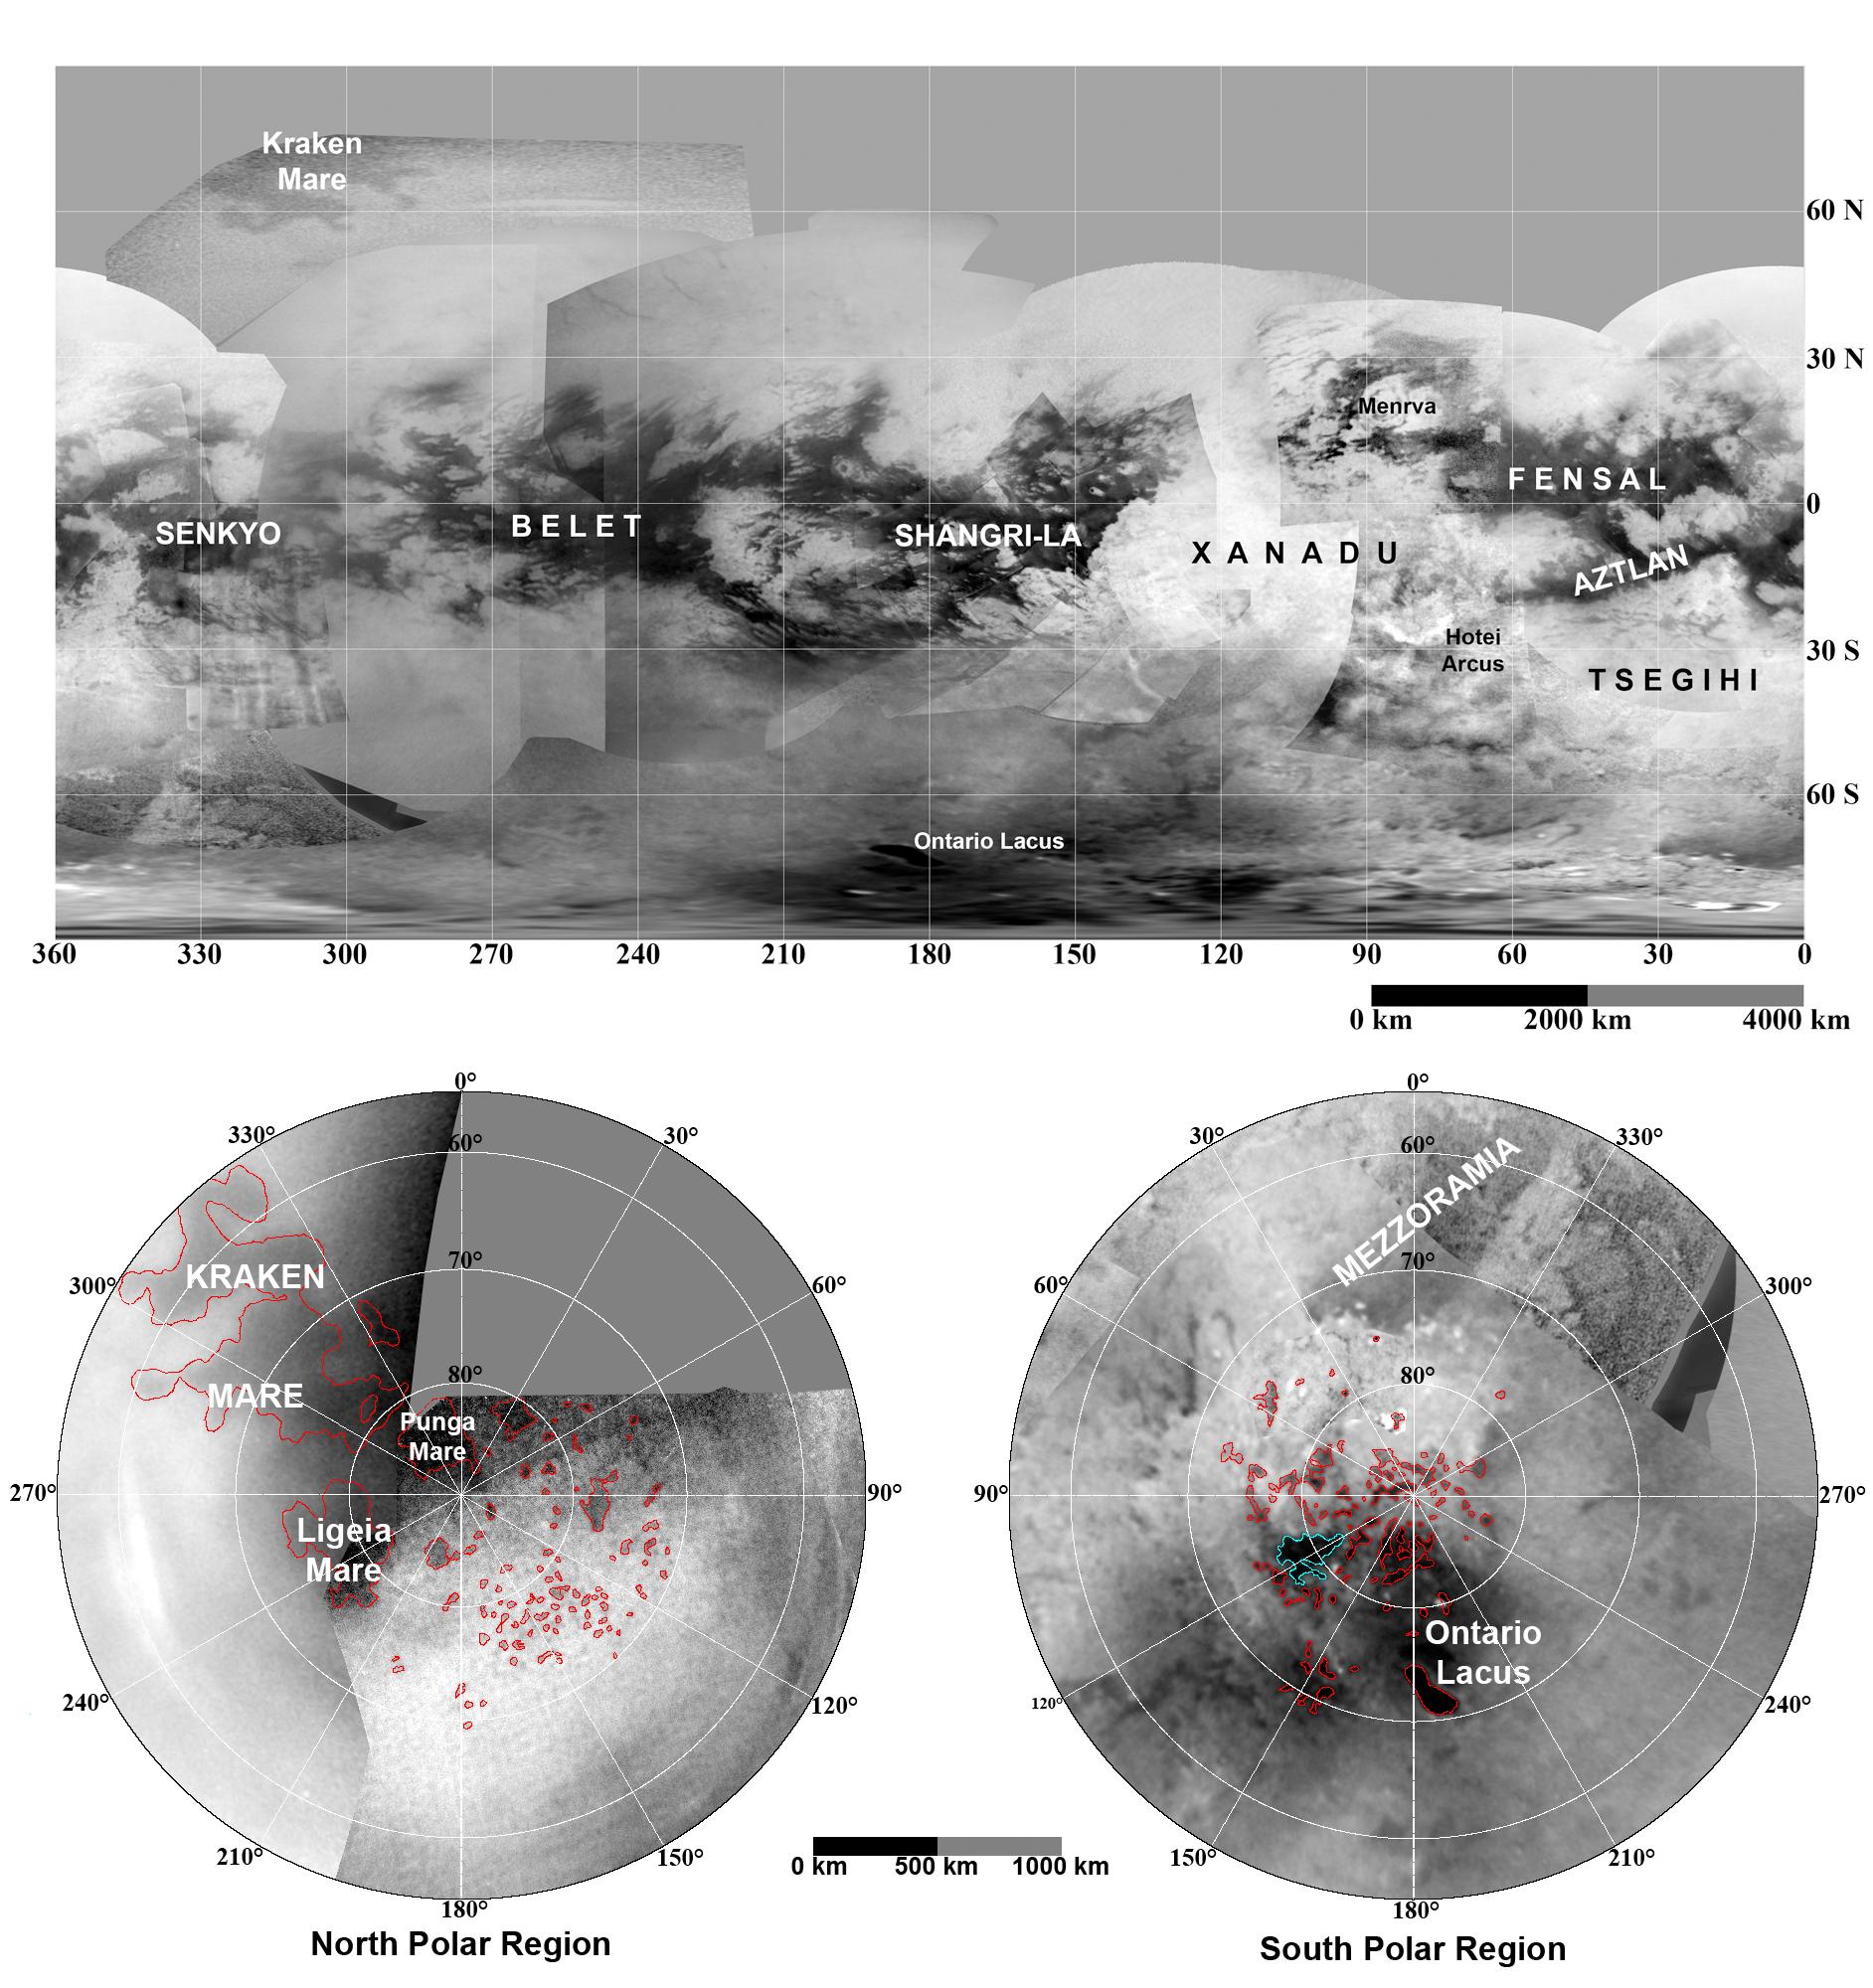
These three updated maps of Saturn's
largest moon, Titan, released on January 29, 2009 were generated
from views dating from April 2004 through August 2008. They incorporate
data from the Cassini Imaging Science Subsystem. The map in the upper
part of the mosaic, which covers the whole globe of Titan, is a simple
cylindrical projection. The circular maps in the lower part of the
mosaic focus on Titan's polar regions: the incomplete map at bottom
left is a north polar projection unveiling landscape or atmospheric
features ranging from 55 degrees north latitude to 90 degrees north
latitude. The lower right map which is a south polar projection covers
the portion ranging from 55 degrees south latitude to 90 degrees
south
latitude. The resolution of landscape or atmospheric features in
the maps varies from a few meters to a few tens of kilometers per
pixel.
In the top map, the northern latitudes are not entirely covered due
to atmospheric effects which complicate integration of data
from the "arctic region". The polar maps, on the other
hand, correctly incorporate the polar views gathered up to now. The
maps notably include
Cassini's August 2008 imaging of Titan's northern hemisphere. Image source: NASA, JPL |
|
|
These mosaics of infrared images
show Titan's south polar region at two different times. The images
were obtained in infrared light at a wavelength of 938 nanometers.
The views have been oriented with the south pole in the center ( black
cross ) and the 0 degree meridian toward the top. The upper left image
was captured on July 3, 2004. The bottom left view is the same image
with names, landmarks and descriptions of the main topographic or atmospheric
features. The right images ( unlabeled at top and labeled at bottom
) were acquired on June 6, 2005. Image source: NASA, JPL |

 |
This infrared view of Titan was
obtained with the Cassini probe narrow-angle camera on December 12,
2008 using a spectral filter sensitive to wavelengths of infrared light
centered at 938 nanometers. The image was captured at a distance of
about 2.361 million kilometers ( 1.467 million miles ) from Saturn's
largest moon and at a Sun-Titan-spacecraft, or phase, angle of 35 degrees. Image source: NASA, JPL |
Titan Images 2008
Titan
Images 2007
Titan
Images 2006
Titan
Images 2005, 2004