Titan Images 2013

This view clearly reveals the blue halo that dominates the upper limits of Titan's deep, thick and opaque atmosphere. A significant contrast appears between the typical orange color of the atmosphere and the blue detached-haze layer that hovers at the boundaries of the atmosphere. The complex haze of the Titanian atmosphere scatters the solar radiation and generates the orange color observed here. The camera is orientated, here, towards the dark side of the giant moon.
This natural-color image was generated by combining images obtained using red, green and blue spectral filters. The views were acquired with the ISS Narrow-Angle Camera of the Cassini spacecraft on November 3, 2013 at a distance of approximately 2.421 million miles or 3.896 million kilometers from the Opaque Moon. The camera is orientated, here, towards the leading hemisphere of Titan that is to say the side of the globe that leads in its orbit around the Ringed Planet Saturn. North appears in the upper part of the disk and is inclined at an angle of 40 degrees to the left.

Image Credit: NASA/JPL-Caltech/Space Science Institute.


The image in the upper part of the table corresponds to a natural-color image of Titan's disk revealing landscape features and, in particular, the lakes or seas found in the high latitudes of the northern hemisphere. The view in the lower part of the table shows the same image with the names of the major lakes or seas assigned to the corresponding pools. One can notice the largest sea known as Kraken Mare as well as Ligeia Mare and Punga Mare. Smaller bodies of liquids can also be identified through the gas blanket such as Jingpo Lacus or Bolsena Lacus. The north polar region appears, today, to be the dampest area on the Opaque Moon and the lakes, seas or rivers seem to be mainly composed of methane and ethane. Water can only appear in its liquid form on the surface of the Orange Moon.
The image was generated by combining views obtained using red, green and blue spectral filters. The views were acquired with the Narrow-Angle Camera of the Cassini probe on October 7, 2013 at a distance of about 809,000 miles or 1.303 million kilometers from the Orange Moon. A special spectral filter was applied in order to see through the haze of the opaque atmosphere and to discern landscape features. The camera, in this view, is orientated towards the leading hemisphere of Titan that is to say the side of the moon that leads in its orbit around the Gas Giant Saturn. North appears in the upper part of the orange disk and is inclined at an angle of 36 degrees to the left.

Image Credit: NASA/JPL-Caltech/Space Science Institute.


The natural-color image above shows a portion of the orange disk of Saturn's largest moon Titan and, in particular, the orange vortex clouds which are developing in the south polar region. One can clearly discern the cyclone at the boundary between the dark side of the disk and the illuminated side of the disk. This view suggests that the vortex clouds form and develop at a much higher altitude than the typical Titanian haze because a portion of the circular shape of the cyclone can be seen through the dark part of the disk. One can also observe the blue detached-haze layer found in the upper part of the Titanian atmosphere.
This natural-color view of the Opaque Moon was produced by combining images obtained using red, green and blue spectral filters. The views were captured with the ISS Narrow-Angle Camera of the Cassini spacecraft on July 30, 2013 at a distance of about 895,000 miles or 1.441 million kilometers from the Orange Moon. The camera is orientated, in this view, towards the trailing hemisphere of Titan and the north on the moon is in the upper part of the disk and inclined at an angle of 17 degrees to the left.

Image Credit: NASA/JPL-Caltech/Space Science Institute.


This natural-color image shows the icy moon Rhea in front of Saturn's largest moon Titan. On can notice the cratered surface of the bright moon Rhea as well as the north polar hood of the Opaque Moon. The north polar hood of Titan appears as a detached haze layer in the upper right part of the orange disk.
The natural-color image was generated on the basis of the combination of images acquired using red, green and blue spectral filters. The views were obtained with the ISS Narrow-Angle Camera of the Cassini probe on June 16, 2011 at a distance of about 1.1 million miles or 1.8 million kilometers from the icy moon Rhea and 1.5 million miles or 2.5 million kilometers from the Orange Moon Titan.
The camera is orientated toward the Saturn-facing side of Rhea and the north on Rhea, in this view, is up and inclined at an angle of 35 degrees to the right. Rhea is largely smaller than Titan with a mean diameter of about 949 miles or 1,528 kilometers compared to the mean diameter of Titan which is at 3,200 miles or 5,150 kilometers. Rhea orbits closer to Saturn than Titan.

Image Credit: NASA/JPL-Caltech/Space Science Institute.


This image corresponds to a colorized mosaic of Titan's north polar region from 50 degrees north latitude to the north pole. This polar stereographic projection was generated on the basis of the radar data obtained from the Radar Mapper of the Cassini probe from 2004 to 2013. This map represents the most complete image yet of the northern land of lakes and seas on the Opaque Moon. The lakes or seas in this polar view appear black or blue depending on the way the radar bounced off the ground. Most of the surface in the area is represented by land areas appearing yellow to white. A haze was incorporated into the map to simulate the Titanian atmosphere.
The lakes or seas in the north polar region seem to be mostly composed of methane and ethane. Three major lakes or seas can be seen in the high latitudes of the northern hemisphere: Kraken Mare, Ligeia Mare and Punga Mare. Kraken Mare can be clearly identified in the lower-right part of the disc. Ligeia Mare which appears to be the second largest body of liquids in the high latitudes of the northern hemisphere and whose shape is reminiscent of a heart is just above it. Punga Mare, which is the third major body of liquids in the area, appears just below the north pole close to the center of the disc.
One can notice that, in the upper left of the north pole, the lakes are particularly small and numerous. Lakes in that region are typically about 30 miles or 50 kilometers across or less. One can observe that most of the bodies of liquid on the Orange Moon are found in the high latitudes of the northern hemisphere. It appears that almost all the Titanian lakes and seas fall into a box covering approximately 600 by 1,100 miles or 900 by 1,800 kilometers. It turns out that only 3 percent of the liquid appears outside of this region.
Planetologists are trying to determine the geologic mechanisms that are generating large topographic depressions capable of retaining lakes or seas in this particular area. Some researchers advance the idea that there may have been a regional extension of the crust. That kind of process can engender faults producing alternating basins and roughly parallel mountain chains. A parallel was drawn between the former Lake Lahontan which covered much of the state of Nevada during the period of cooler climate 13,000 years ago and the area of concentrated lakes or seas on Saturn's largest moon which appears bigger. The geologic processes that may account for the presence of the giant lakes or seas in the high latitudes of the northern hemisphere may be, to a certain extent, similar to the geologic processes that shaped the Basin and Range province of the western United States.

Image Credit: NASA/JPL-Caltech/ASI/USGS.


This view unveils the sunlit edge of the bright vortex of Saturn's largest moon Titan in the darkness of the south polar region. One can clearly see through the disc of the Opaque Moon landscape features, the dark regions in the low latitudes of the moon as well as the bright south polar vortex which has been developing for a while. The brightness of the long-standing vortex marks a contrast with the unilluminated hazy atmosphere. The views of the vortex obtained from the Cassini probe led researchers to infer that its clouds take shape at a much higher altitude than the surrounding haze.
This image was acquired with the Narrow-Angle Camera of the Cassini spacecraft on July 14, 2013 with a spectral filter sensitive to wavelengths of near-infrared radiation centered at 938 nanometers. The view was taken at a distance of about 808,000 miles or 1.3 million kilometers from the Orange Moon and at a Sun-Titan-probe, or phase, angle of 82 degrees. The camera is orientated toward the trailing hemisphere of the Opaque Moon. The North on Saturn's largest moon is up and rotated 32 degrees to the left.

Image Credit: NASA/JPL-Caltech/Space Science Institute.


The near-infrared image above shows the disc of Saturn's largest moon Titan. One can notice in the equatorial and tropical areas the sharp contrast between dark areas and bright areas. A portion of the dark Kraken Mare can be seen in the upper part of the disc. Fensal/Aztlan and Senkyo, two well known dark regions of the equatorial or tropical areas of the moon, can be seen here. Senkyo may be mainly composed of Seif Dunes containing hydrocarbon molecules that may have precipitated out of the haze of the orange atmosphere. One can observe a bright patch in the atmosphere above the south polar region. That may correspond to a seasonal polar vortex developing over the south polar region.
In this view of the Titanian disc, the camera is orientated toward the Saturn-facing hemisphere of the Opaque Moon. North is in the upper part of the disc and is tilted 4 degrees to the left. The view was obtained with the Narrow-Angle Camera of the Cassini probe on June 16, 2013 with a spectral filter sensitive to wavelengths of near-infrared light centered at 938 nanometers.

Image Credit: NASA/JPL-Caltech/Space Science Institute.


The mosaic in the upper part of the table, generated on the basis of near-infrared images from the Imaging Science Subsystem on September 12, 2013, reveals a portion of the north polar region in which one can clearly notice a myriad of lakes and seas. The views were taken with a spectral filter sensitive to wavelengths of near-infrared light centered at 938 nanometers. This wavelength is relatively close to the visible spectrum.
Researchers combined 10 image footprints of four images to increase signal from the Titanian ground through the hazy layers of the thick and deep atmosphere. The ISS images of the north polar area acquired during three recent flybys show a better viewing geometry than the images obtained in the previous flybys because they were oblique, partial or because they were taken too far away.
When the Cassini probe reached the Saturn System in 2004, the north polar region was plunged into the darkness of the Winter season. But today, the Summer season in the northern hemisphere is approaching and the solar radiations reaching the north polar region are stronger and stronger. The recent near-infrared views show that the thick cap of haze that was engulfing the north polar region some time ago has dissipated and no rainfall or significant clouds can be seen in the recent images.
The terrain shown in this view is approximately 1,000 miles or 2,000 kilometers from top to bottom and the image scale is 1,760 feet or 536 meters per pixel. The mosaic in the lower part of the table corresponds to the annotated version of the mosaic shown in the upper part of the table. One can notice a portion of the largest surface body of liquids on Titan known as Kraken Mare.
The dark Ligeia Mare appears to be the second largest pool in the area. Ligeia Mare is 300 miles or 500 kilometers across. Punga Mare is a little smaller since it is approximately 240 miles or 380 kilometers across. To the left of Punga Mare, one can notice a dark cross indicating the north pole of Saturn's largest moon. The area shows a myriad of lakes such as Jingpo Lacus, Bolsena Lacus or Ladoga Lacus.
The lakes, seas or rivers of the north polar region are believed to be mainly composed of liquid ethane and liquid methane. To the human eye, they may appear darker than the terrain around them. One can observe that the areas surrounding most of the lakes or seas are particularly bright. Scientists believe that there is a close relationship between the lakes or seas and the nature of the soil around them. The bright areas surrounding the lakes or seas may correspond to a bright deposit resulting from cryovolcanic eruptions.
The lakes may be found in a karst terrain inside which caves or networks of subsurface rivers or lakes can take shape because liquids can dissolve soluble bedrock. That kind of karst terrain can be found on our planet in places like Calern in the south east of France or in New Mexico with the Carlsbad Caverns. Researchers advance the idea that some lakes may have appeared from the collapse of land following a volcanic eruption.

Image Credit: NASA/JPL-Caltech/SSI/JHUAPL/University of Arizona.


The mosaic in the upper part of the table corresponds to a near-infrared image of a portion of the globe of Saturn's largest moon Titan. One can notice in particular multiple lakes or seas in the upper part of the semi disc as well as bright patches around some of the lakes or seas. A bright rounded shape surrounded by a dark area can also be observed in the lower part of the semi disc. The mosaic in the lower part of the table unveils the same area with the name of the main landscape features and some descriptions.
Surprisingly, the lakes, seas and rivers appear to be mainly concentrated in the north polar region while the low latitudes appear to be relatively dry, dominated in their dark regions by Seif Dunes. The annotated version of the mosaic in the lower part of the table indicates the name and the location of the three main surface bodies of liquids in the north polar region. Kraken Mare is apparently the largest pool of liquids in the north polar region. Ligeia Mare is the second largest pool of liquids since it measures approximately 300 miles or 500 kilometers across. Punga Mare is slightly smaller since it measures approximately 240 miles or 380 kilometers across.
The lakes seem to be mainly composed of liquid ethane and methane. Water can't appear in its liquid form on the surface of Titan due to the very harsh environment. Water can only appear in its solid form on the surface. One can notice that some lakes or seas are surrounded by particularly bright areas. The bright areas may correspond to a bright deposit resulting from evaporation processes or resulting from cryovolcanic eruptions. There may be a close link between the north polar lakes or seas and the bright areas. The bright area seems to cover much of the ground north of 65 to 70 degrees north latitude on this side of the Orange Moon.
Researchers advance several hypotheses to account for the presence of this myriad of lakes and seas and for the presence of the bright material. The lakes or seas may have taken shape from the collapse of land after a cryovolcanic eruption or they may be related to karst terrain where liquids dissolve soluble bedrock. This type of terrain which can engender caves or networks of subsurface rivers or lakes is common on Earth. Karst terrain can be found in the south east of France in Calern or in New Mexico with the Carlsbad Caverns.
The dark cross near Punga Mare, found in the annotated version of the mosaic, indicates the north pole. In this mosaic, the features in the high latitudes can be well discerned whereas the the surface features in the lower latitudes are more difficult to clearly identify simply because they were close to the horizon when these high-latitude images were obtained. Menrva which corresponds to a bright impact crater is a feature of interest that can be clearly seen in the lower part of the semi disc. One can observe that Menrva is surrounded by a dark area which appears to be dominated by dunes.
This mosaic is composed of near-infrared images taken by the Imaging Science Subsystem of the Cassini probe on July 26, 2013. The images were captured with a spectral filter sensitive to wavelengths of near-infrared light centered at 938 nanometers. The mosaic was assembled on the basis of seven imaging footprints, involving four views each, in order to increase the signal from the ground through the hazy layers of the atmosphere. In the mosaic, the image scale is 1.78 miles or 2.86 kilometers per pixel.
The near-infrared images of the north polar region, obtained from the Cassini probe in three recent flybys, are of better quality than the previous ones because the viewing geometry is better. The previous images of the north polar region taken from the ISS were distant, oblique or partial views. And when the Cassini probe reached the Saturn System in 2004, the north polar region was in the darkness of the Winter period. Now, the Summer season in the northern hemisphere is approaching and the solar radiations hitting the north polar region are stronger and stronger. One can notice that the thick cap of haze that could be seen above the north polar region some time ago has apparently dissipated. One can also observe a nice weather and no apparent signs of significant clouds or rainfall in the north polar region during the flyby of July 26, 2013.

Image Credit: NASA/JPL-Caltech/SSI/JHUAPL/University of Arizona.


The mosaic in the upper part of the table, showing the north polar area of Saturn's largest moon Titan, corresponds to a near-infrared view combining several images taken from the Imaging Science Subsystem of the Cassini spacecraft on July 10, 2013. The images were acquired using a spectral filter sensitive to wavelengths of near-infrared light centered at 938 nanometers. The researchers used seven imaging footprints with four views per footprint to generate this mosaic and to get a better signal from Titan's surface through the hazy and opaque atmosphere. In this view, the image scale is 1.8 miles or 2.9 kilometers per pixel. The mosaic in the lower part of the table represents the same image as the mosaic in the upper part of the table with annotations for the names of the lakes or seas and for the description of geologic or topographic features.
One can notice multiple lakes or seas in the north polar area of the Orange Moon. The dark Kraken Mare, which is undoubtedly the largest surface body of liquids on Titan, can be clearly identified in the upper right part of the mosaic. To its left, Ligeia Mare and Punga Mare can be clearly observed as well. Ligeia Mare appears to be the second largest sea or lake of the area since it is approximately 300 miles or 500 kilometers across. Punga Mare is a little smaller since the lake is approximately 240 miles or 380 kilometers across. The north pole can be found to the left of Punga Mare. A black cross has been incorporated into the mosaic to show the north pole.
The lakes or seas are believed to be mainly composed of ethane and methane which can appear in their liquid form on the surface of Titan. Some particularly bright areas can be clearly identified around most of the lakes or seas. There may be a close relationship between the surface bodies of liquids and those bright patches or this bright deposit. Are the bright patches related to evaporated lakes or seas ? Are they related to cryovolcanism ? Researchers advance several hypotheses to account for the concentration of lakes and seas in the north polar region. The lakes or seas may result from the collapse of the land or the crust due to a volcanic eruption.
The terrain in the area may be karstic or porous and liquids may dissolve soluble bedrock engendering caves and underground networks of rivers or lakes. Karst terrains on our planet are widespread. One could mention Calern in the south east of France or the Carlsbad Caverns in New Mexico. Scientists are intrigued by the degree of brightness of some areas around the lakes or seas in the north polar region. The surface features are generally not as bright in the mid-latitudes for instance. Are the bright areas composed of a relatively pure water ice ? Or is it the outcome of a relatively fresh deposit resulting from cryovolcanic eruptions ?
In the lower part of the mosaic, one can also notice a bright patch corresponding to Menrva which appears to be the largest impact crater. This circular feature is surrounded by darker areas dominated by dunes. Let's note that features found at low latitudes are more difficult to discern because they were close to the horizon when these high-latitude views were performed. The viewing geometry of the north polar area is better in the images of the three recent flybys focusing on the north polar region than in the images obtained in the past which were oblique or partial. The Summer season is now approaching in the northern hemisphere and the solar radiation is invading the area. That was not the case a few years ago during the Winter season in the northern hemisphere. The area appeared to be free of clouds and rain during the recent flybys. The thick haze which had been seen over the north polar region some time ago appears to have dissipated.

Image Credit: NASA/JPL-Caltech/SSI/JHUAPL/University of Arizona.


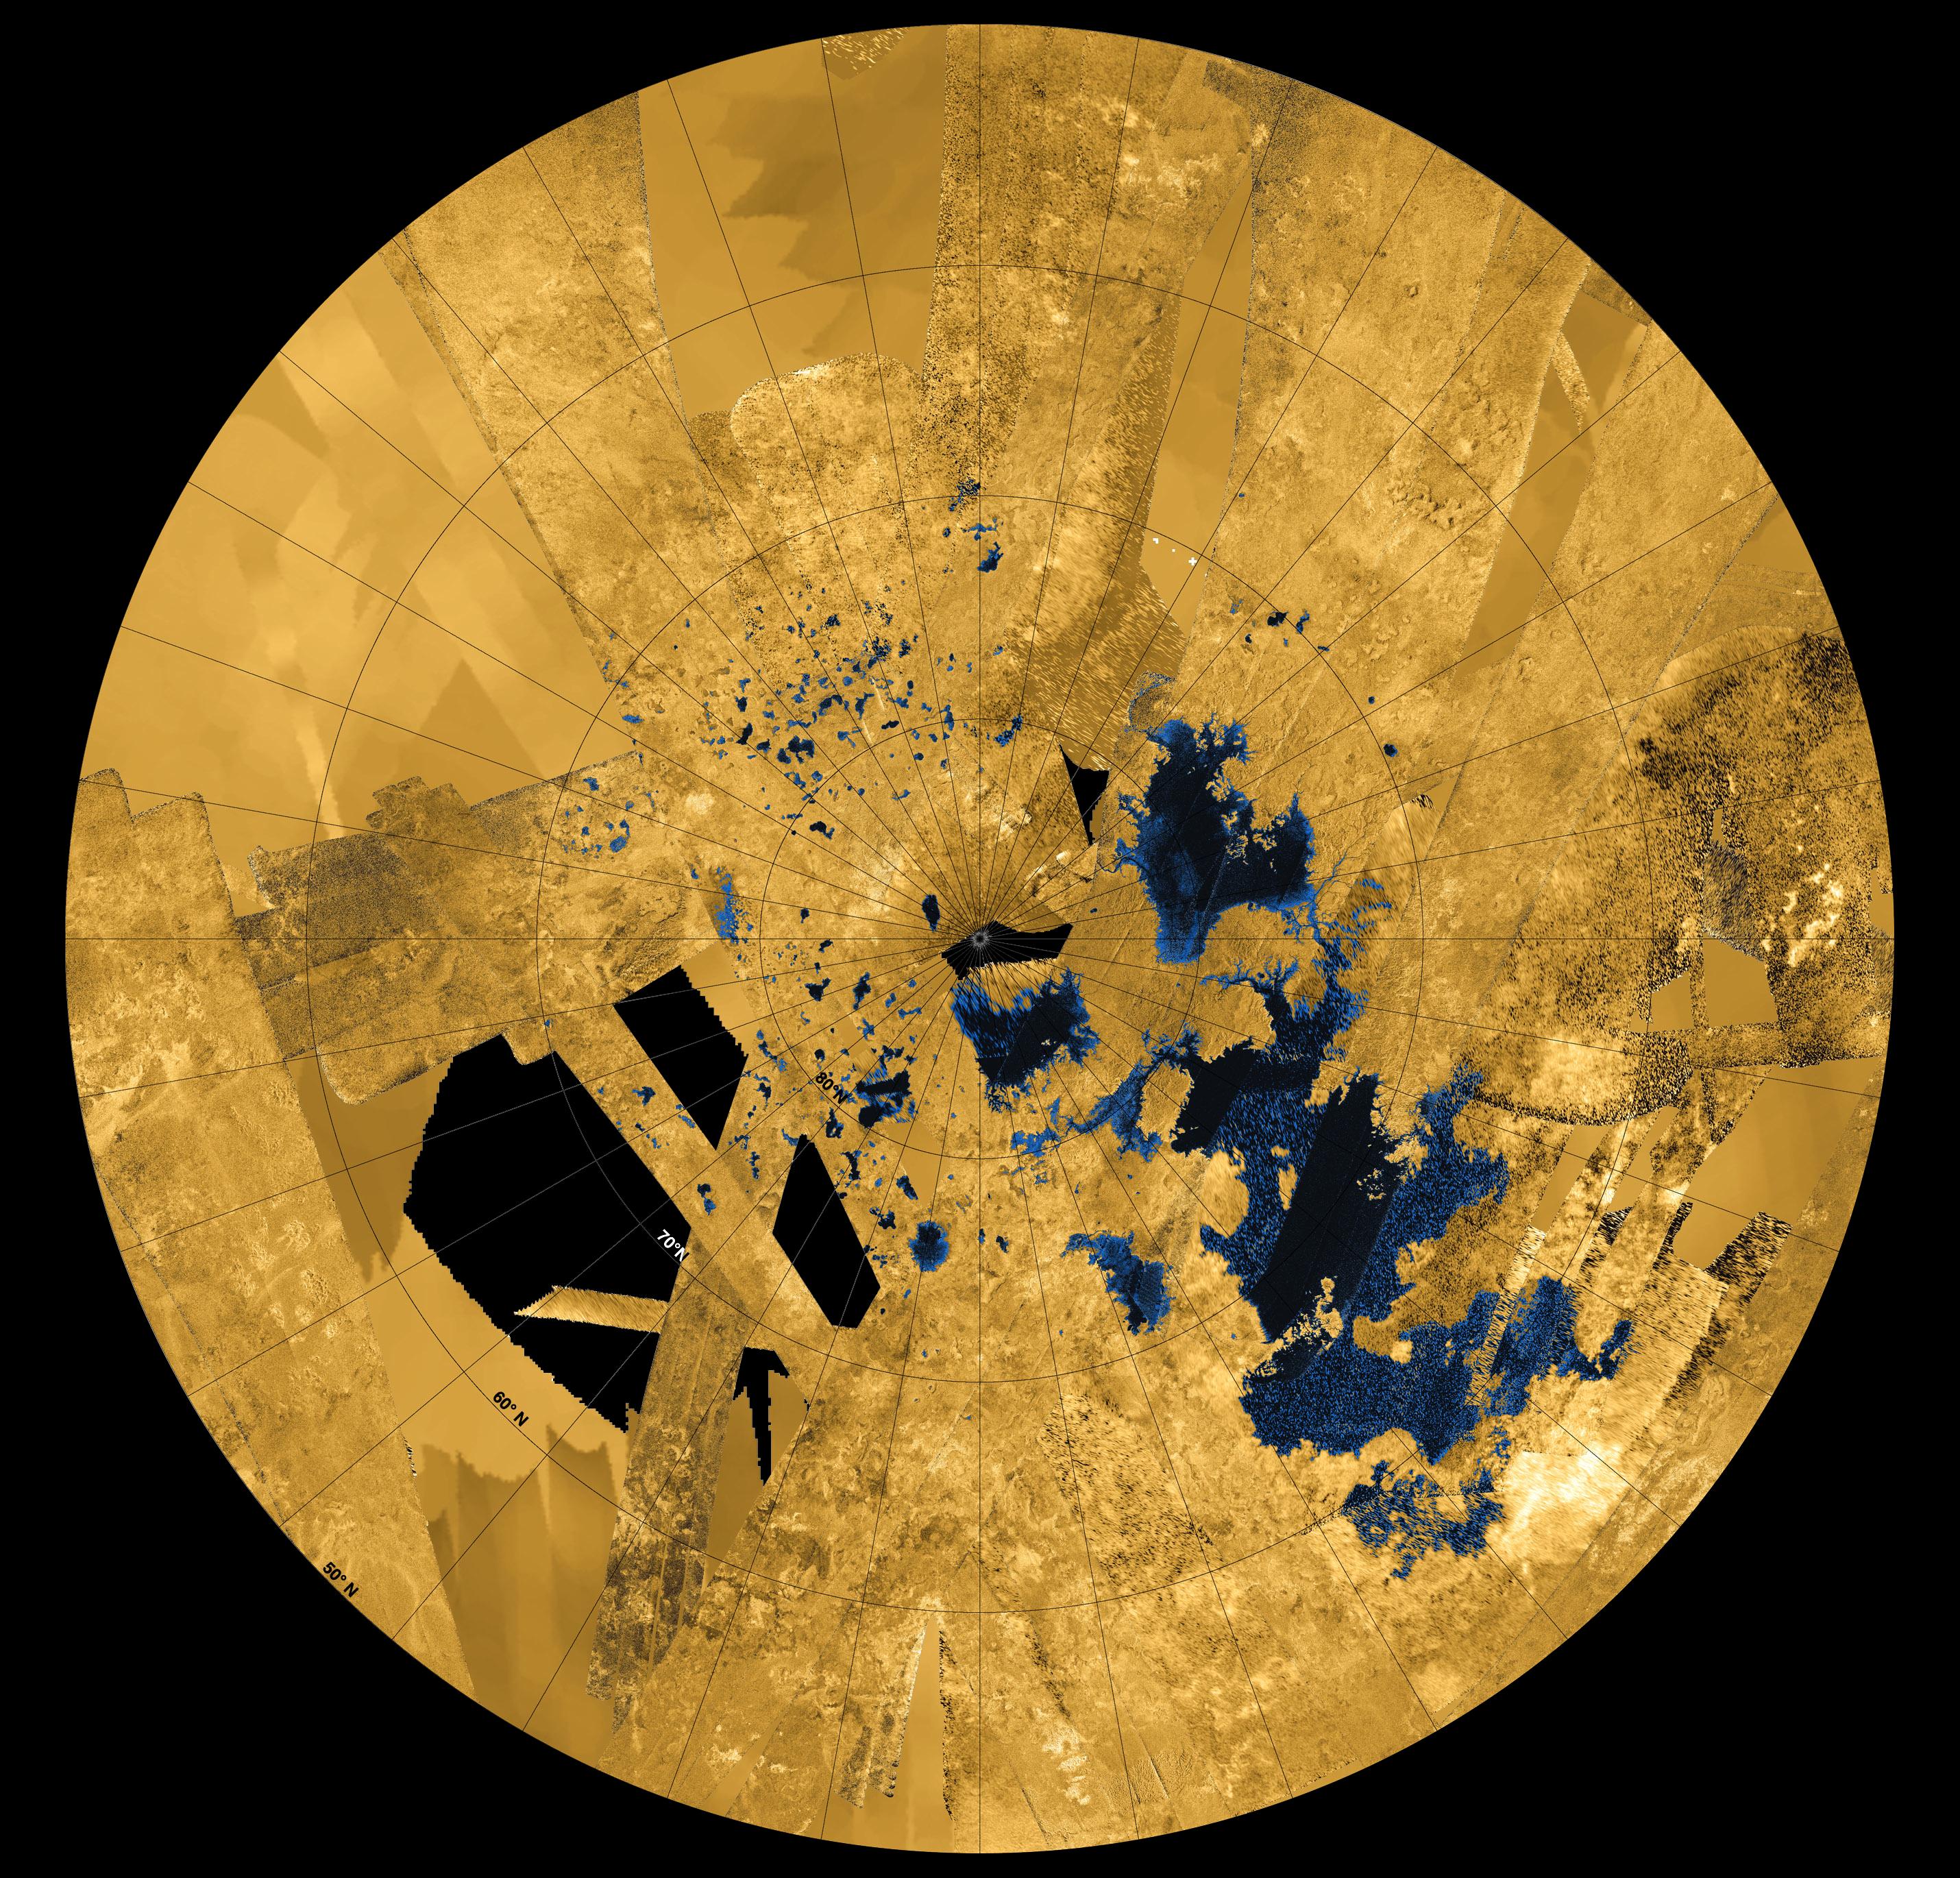
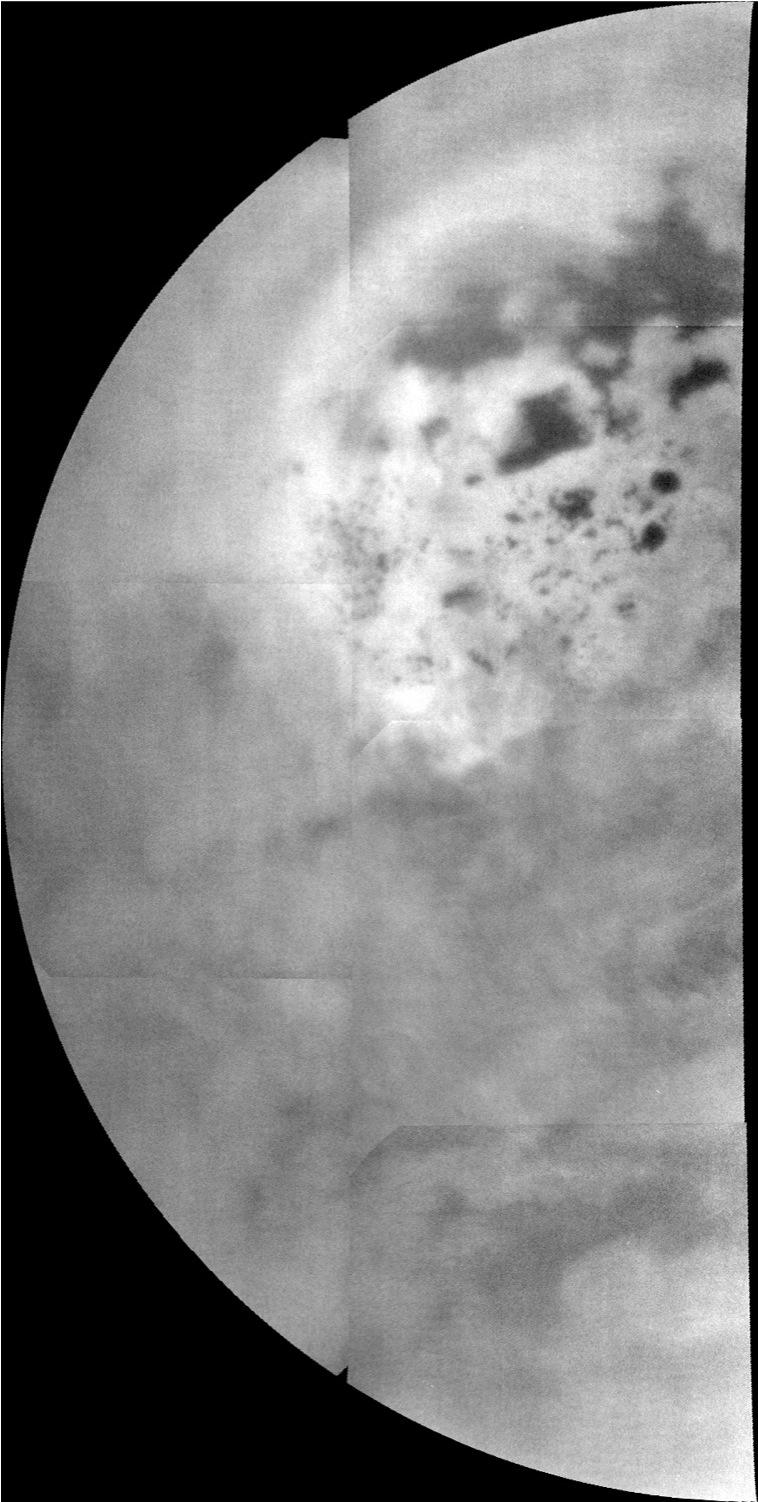
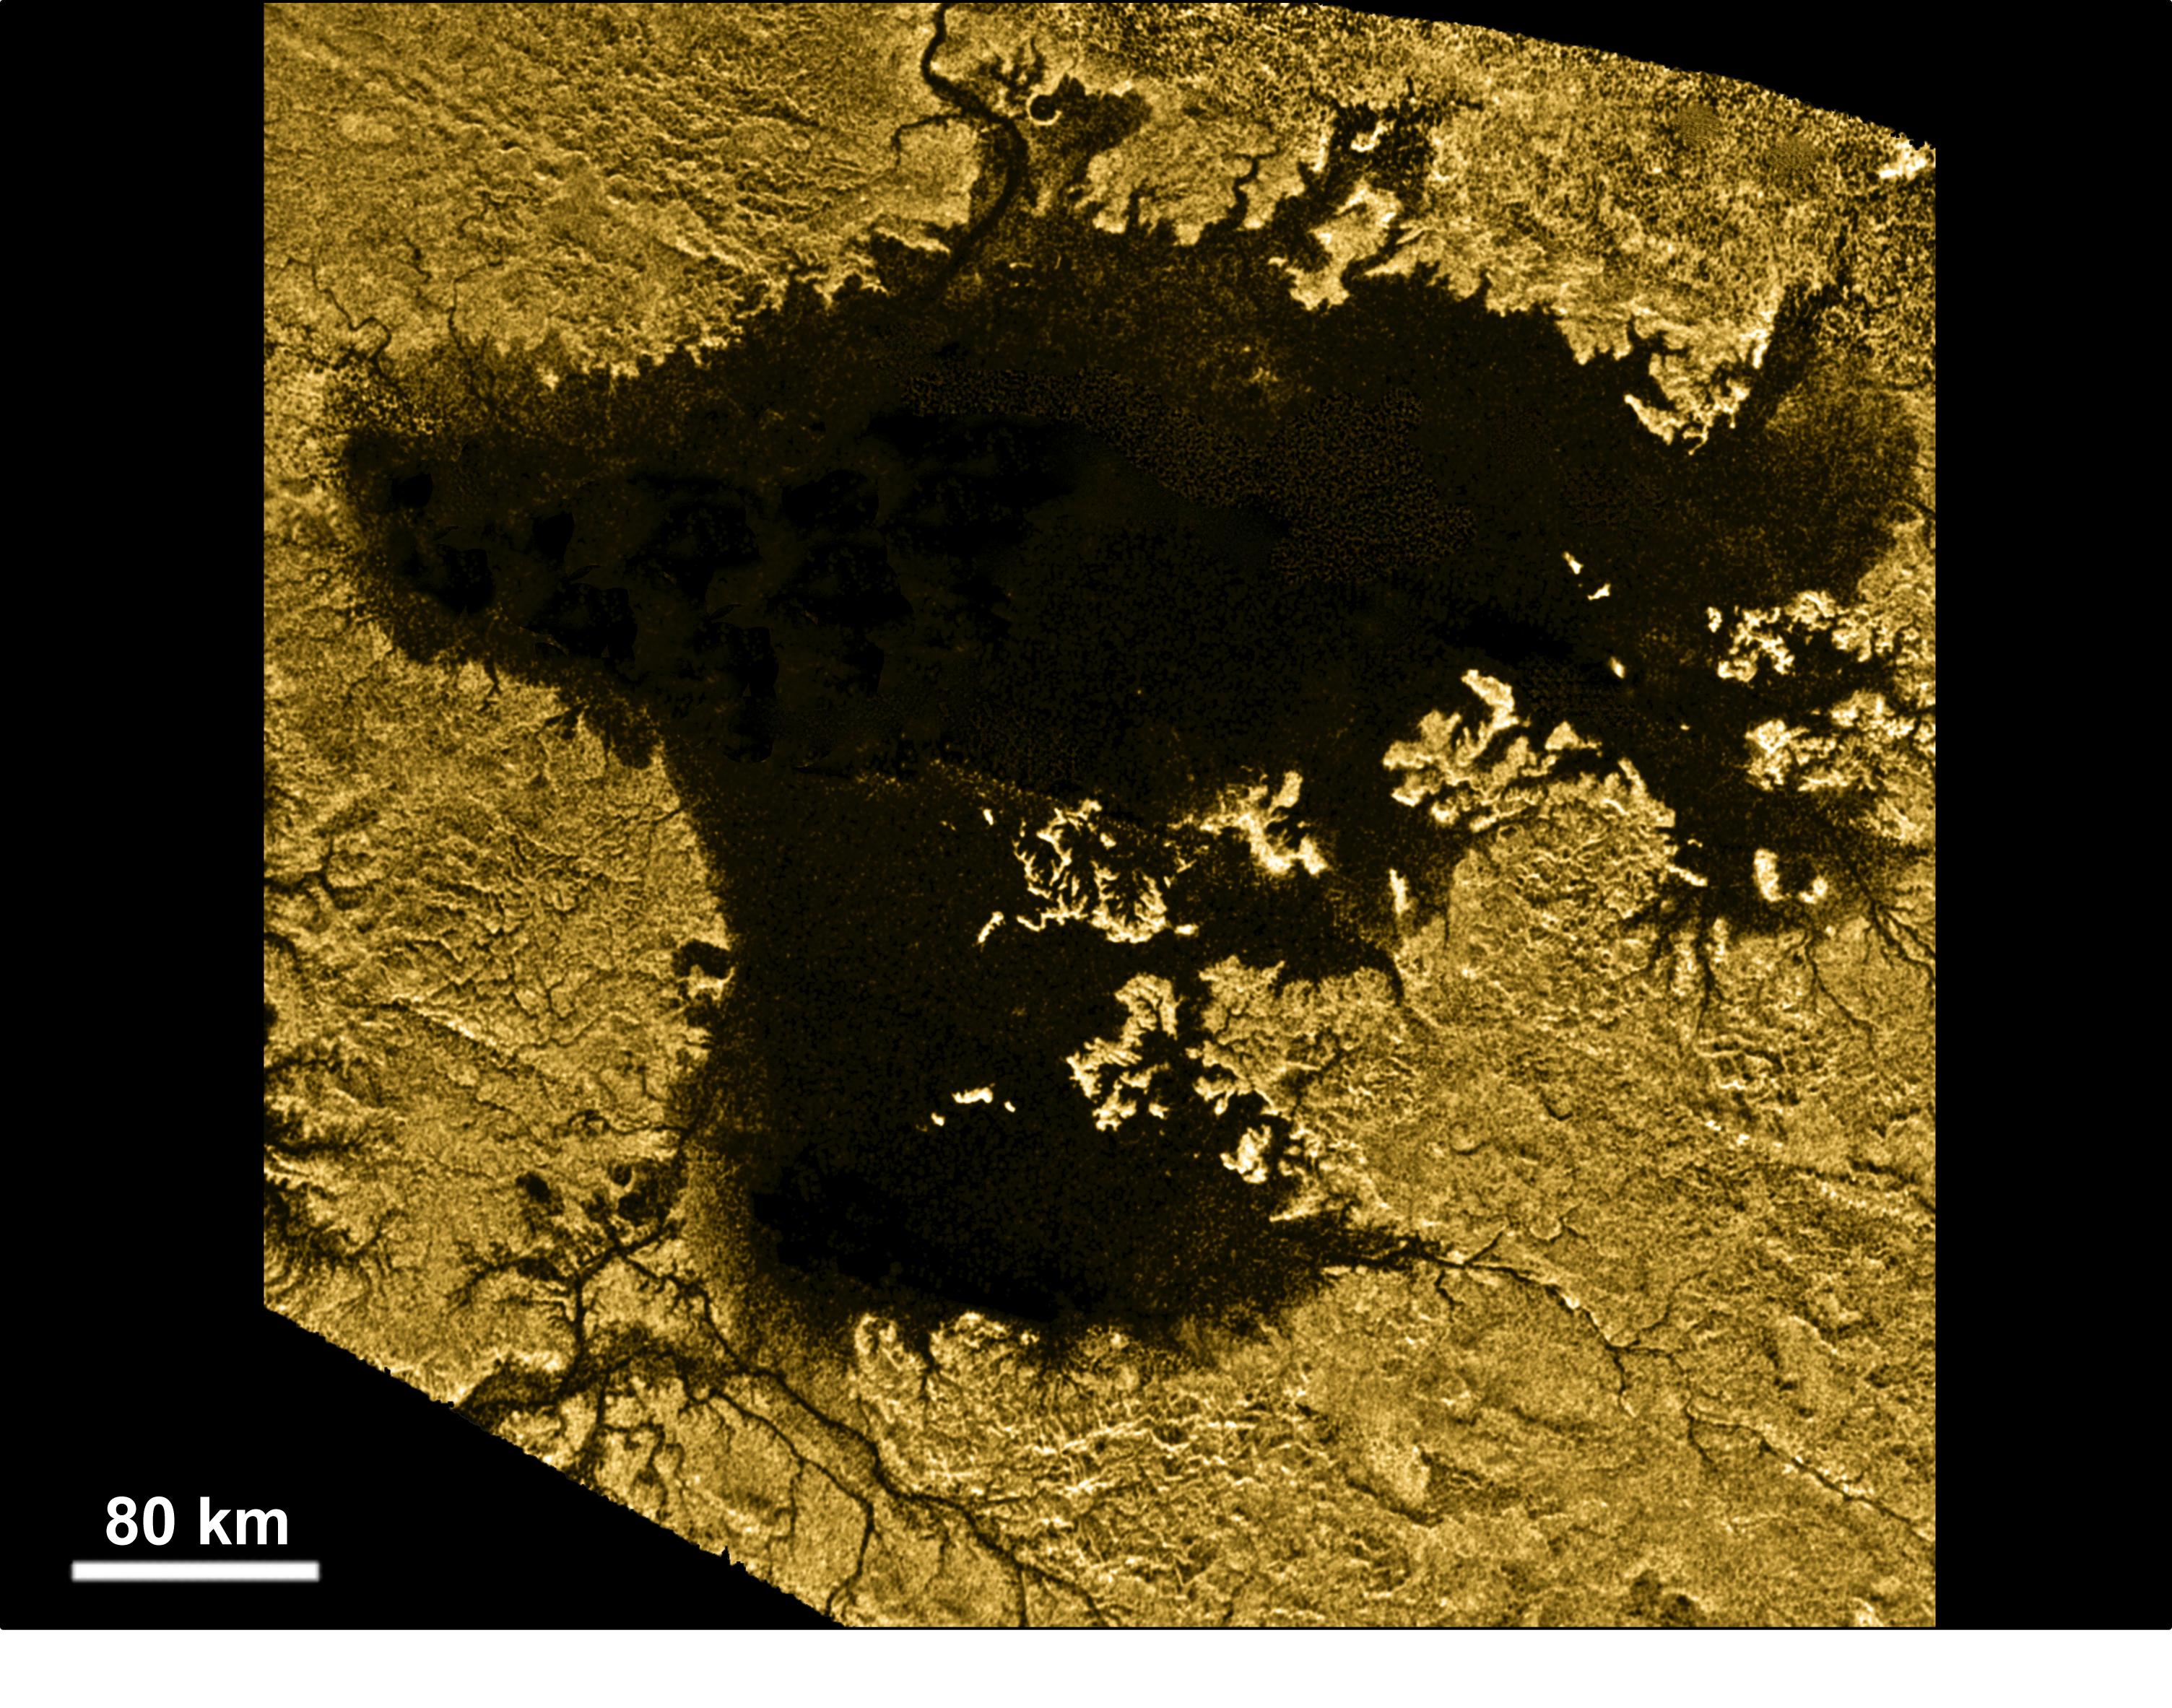
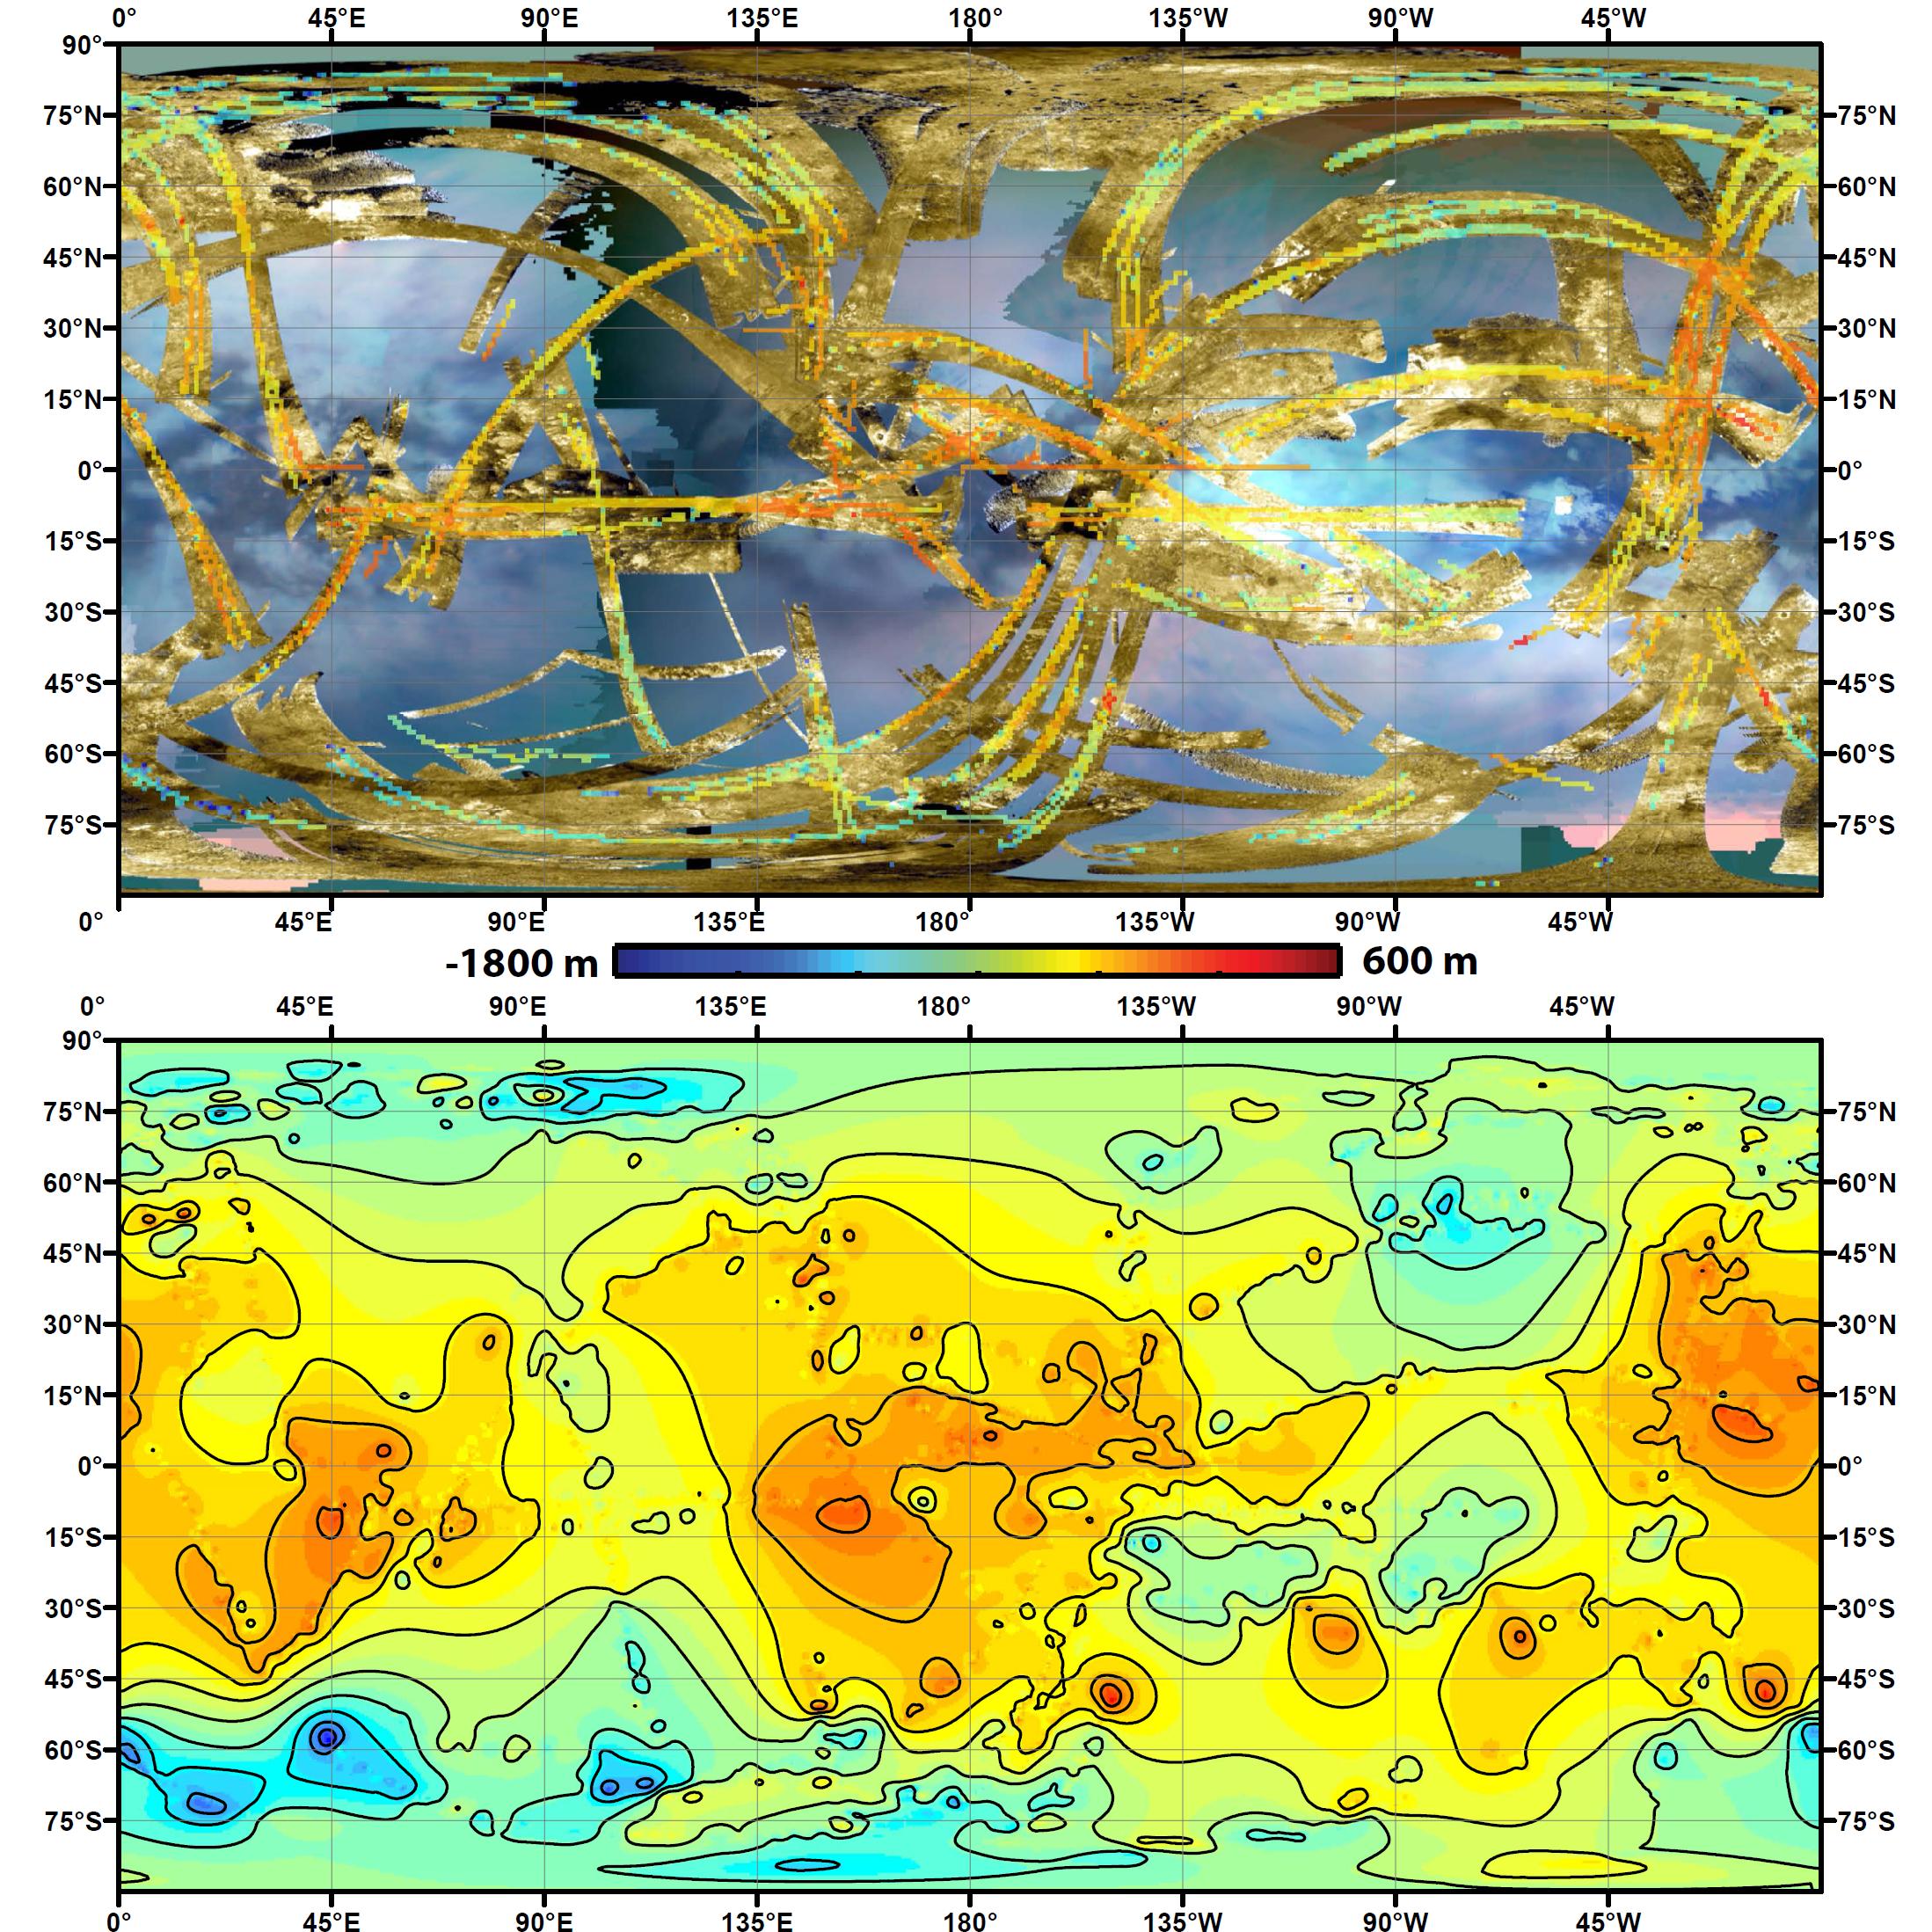
The false-color mosaic, in the upper part of the table, represents a global view of Titan's surface. The north polar region of Saturn's largest moon can be clearly seen in this image. The high latitudes of the northern hemisphere appear to be damp areas composed of a multitude of seas, lakes and rivers. The bodies of liquids found on the surface of the high latitudes seem to be mainly composed of ethane and methane, two hydrocarbons which can appear in their liquid form on the surface. Water can't appear in its liquid form on the surface of Titan. Water may be widespread on the ground, in its solid form.
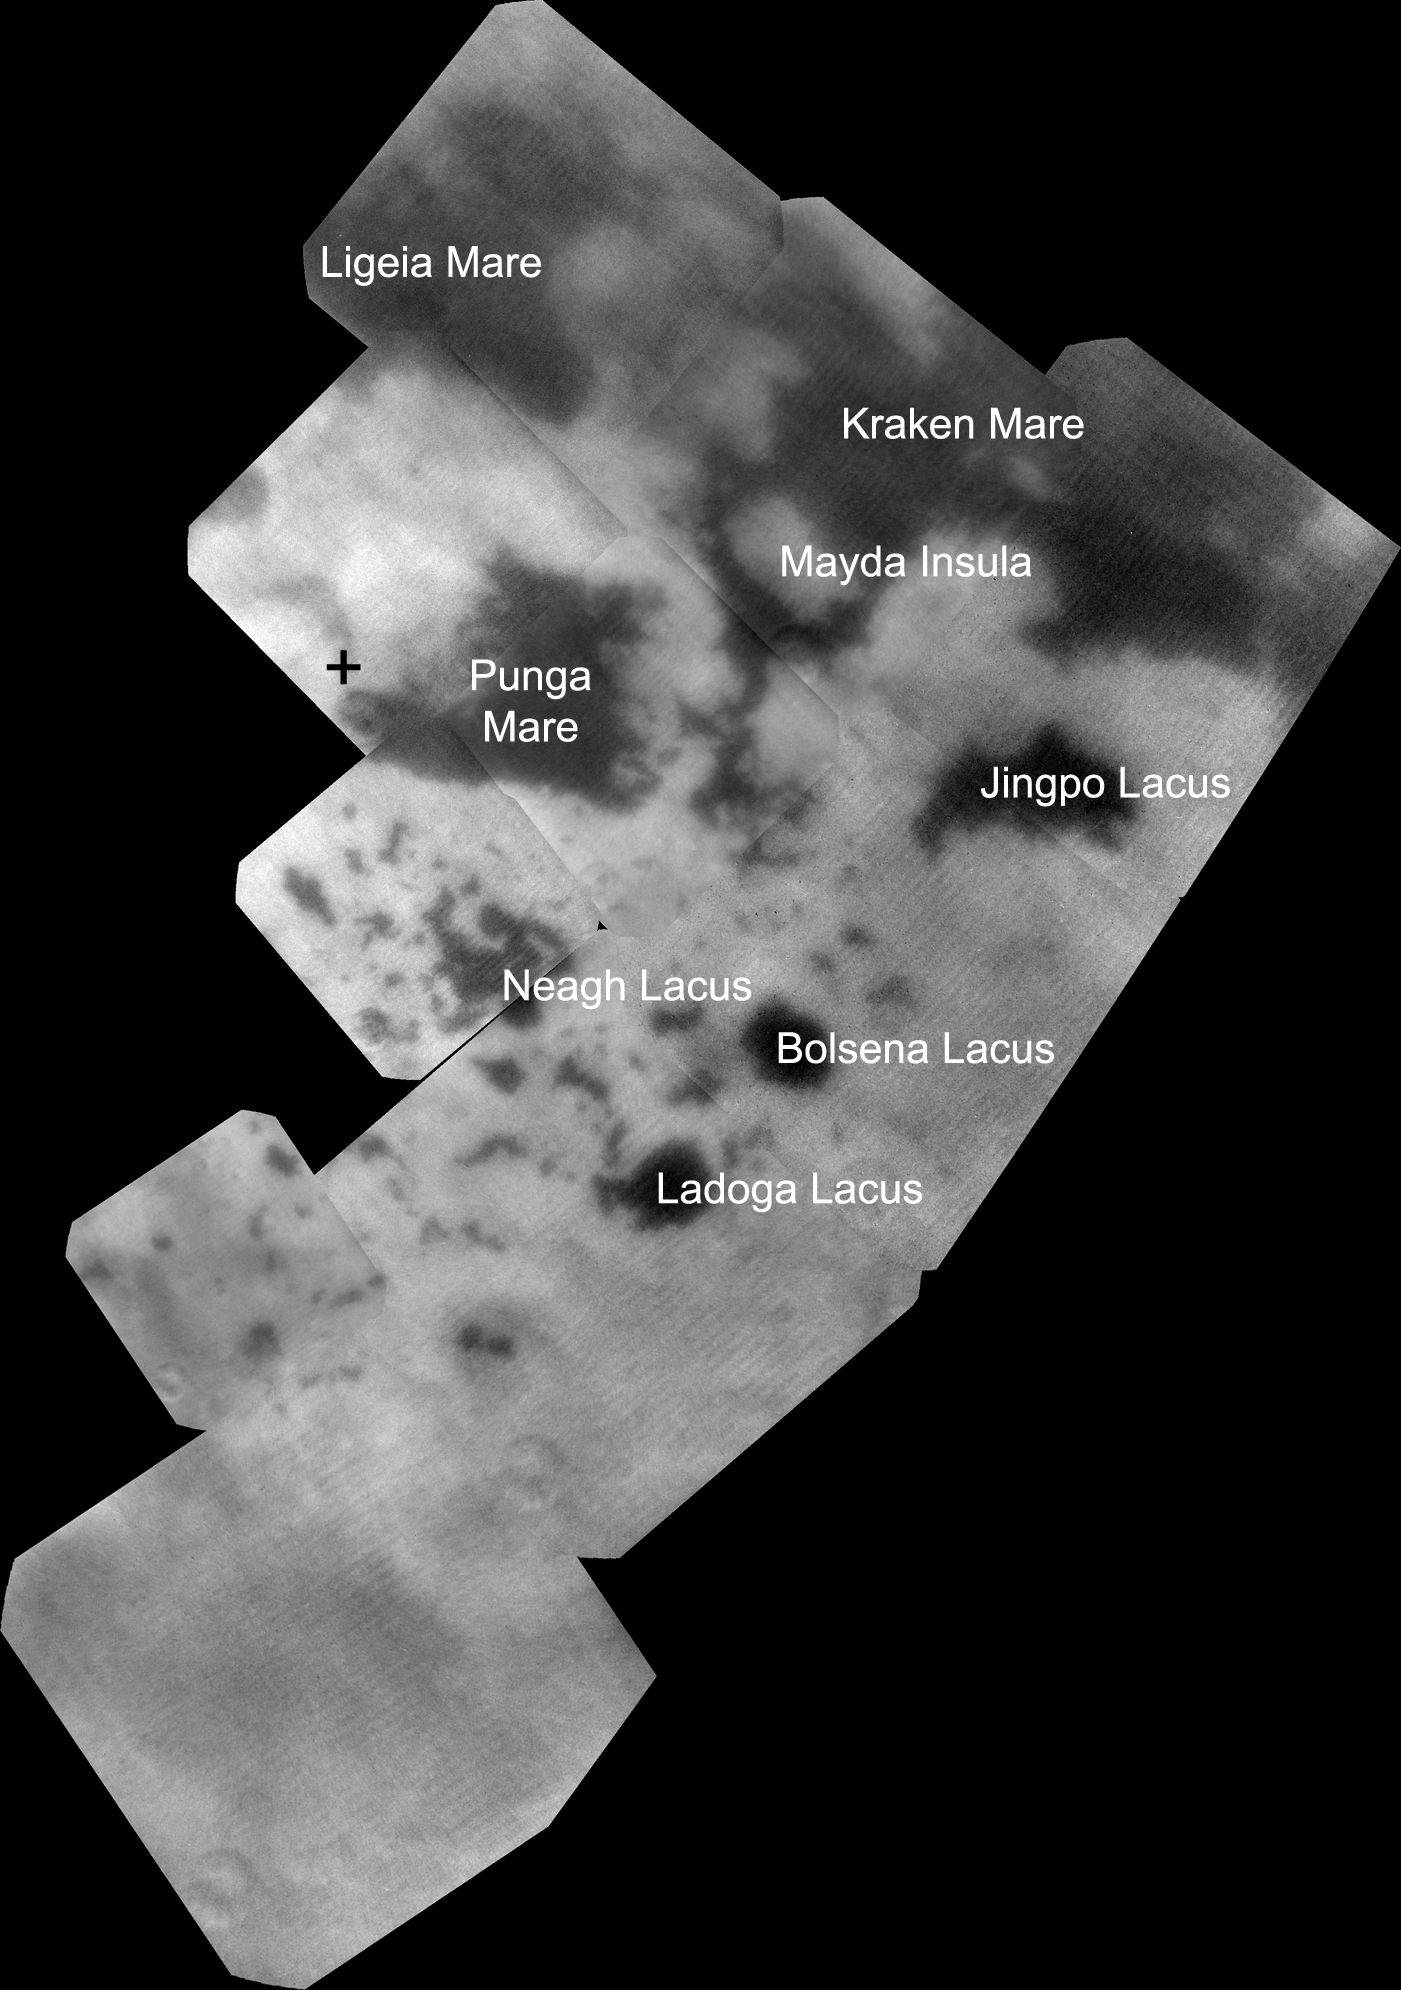
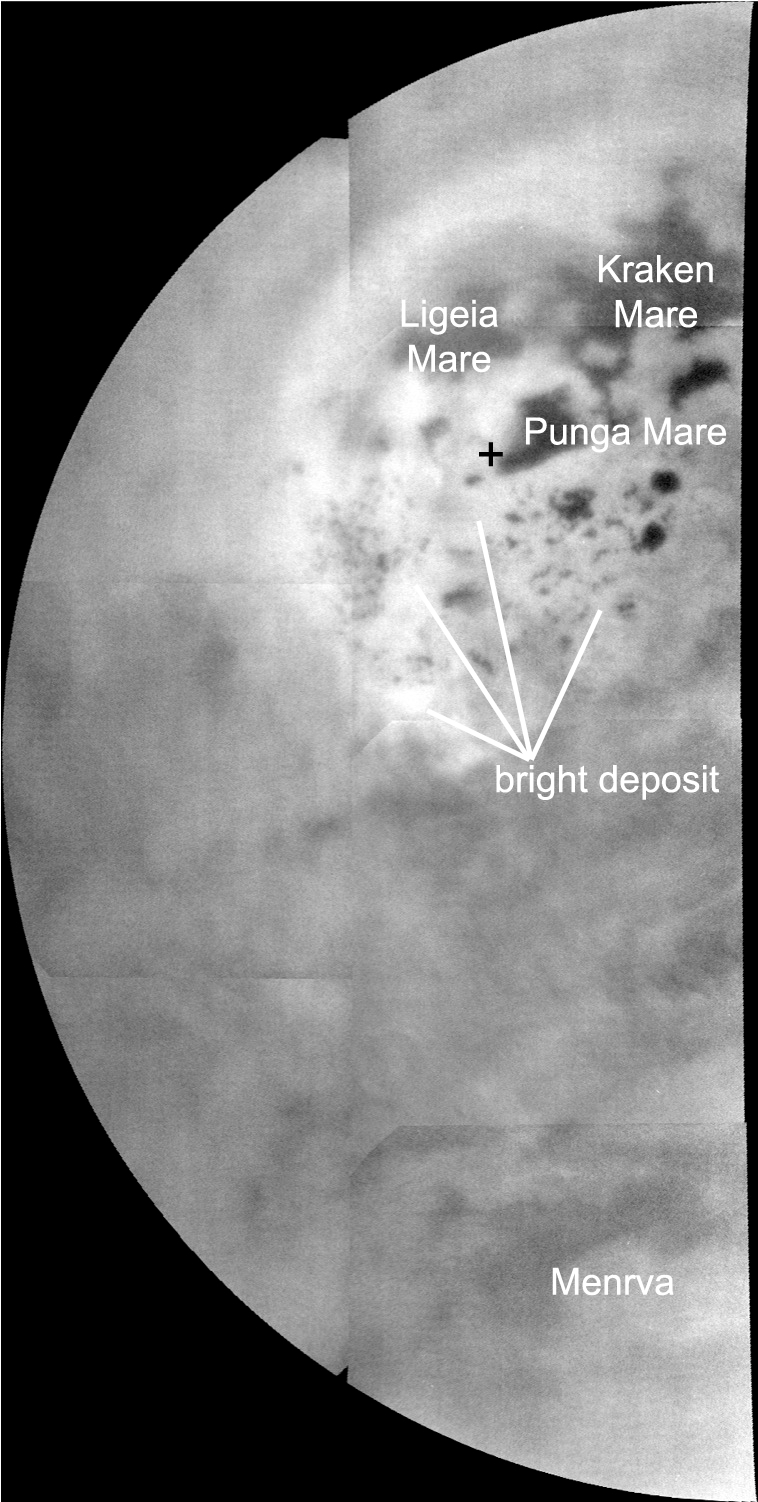
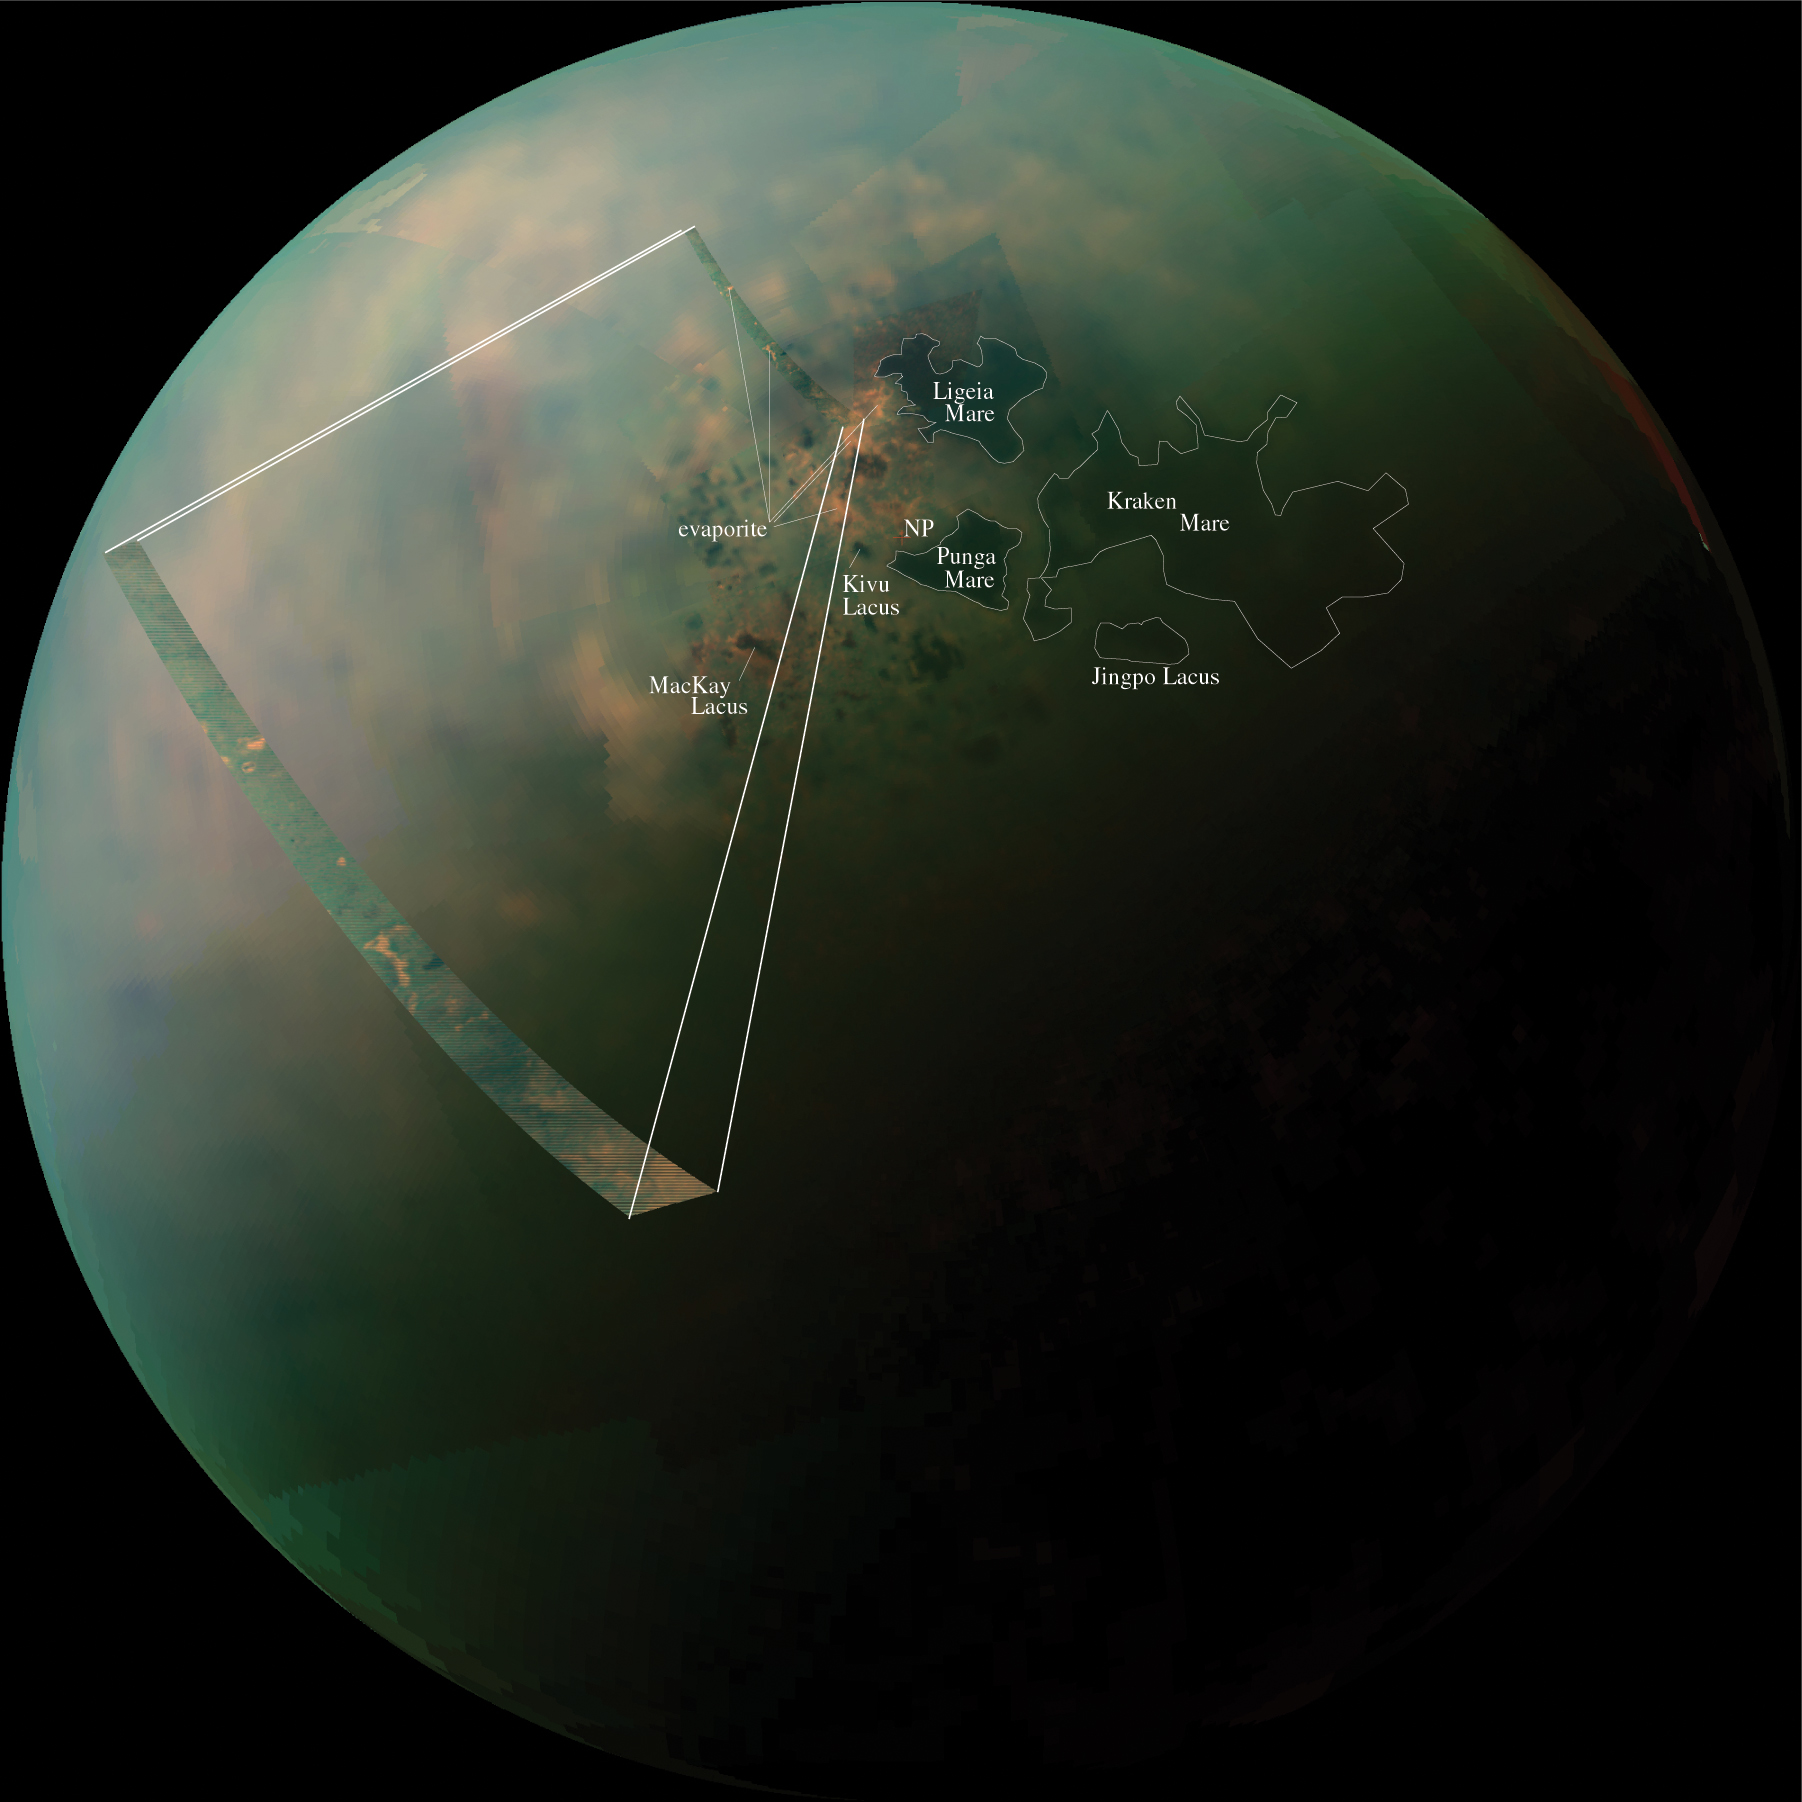
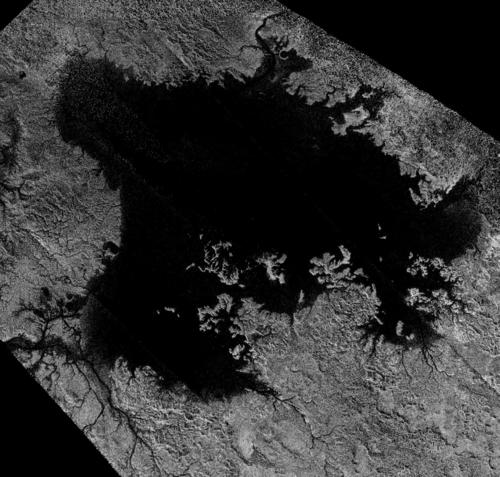
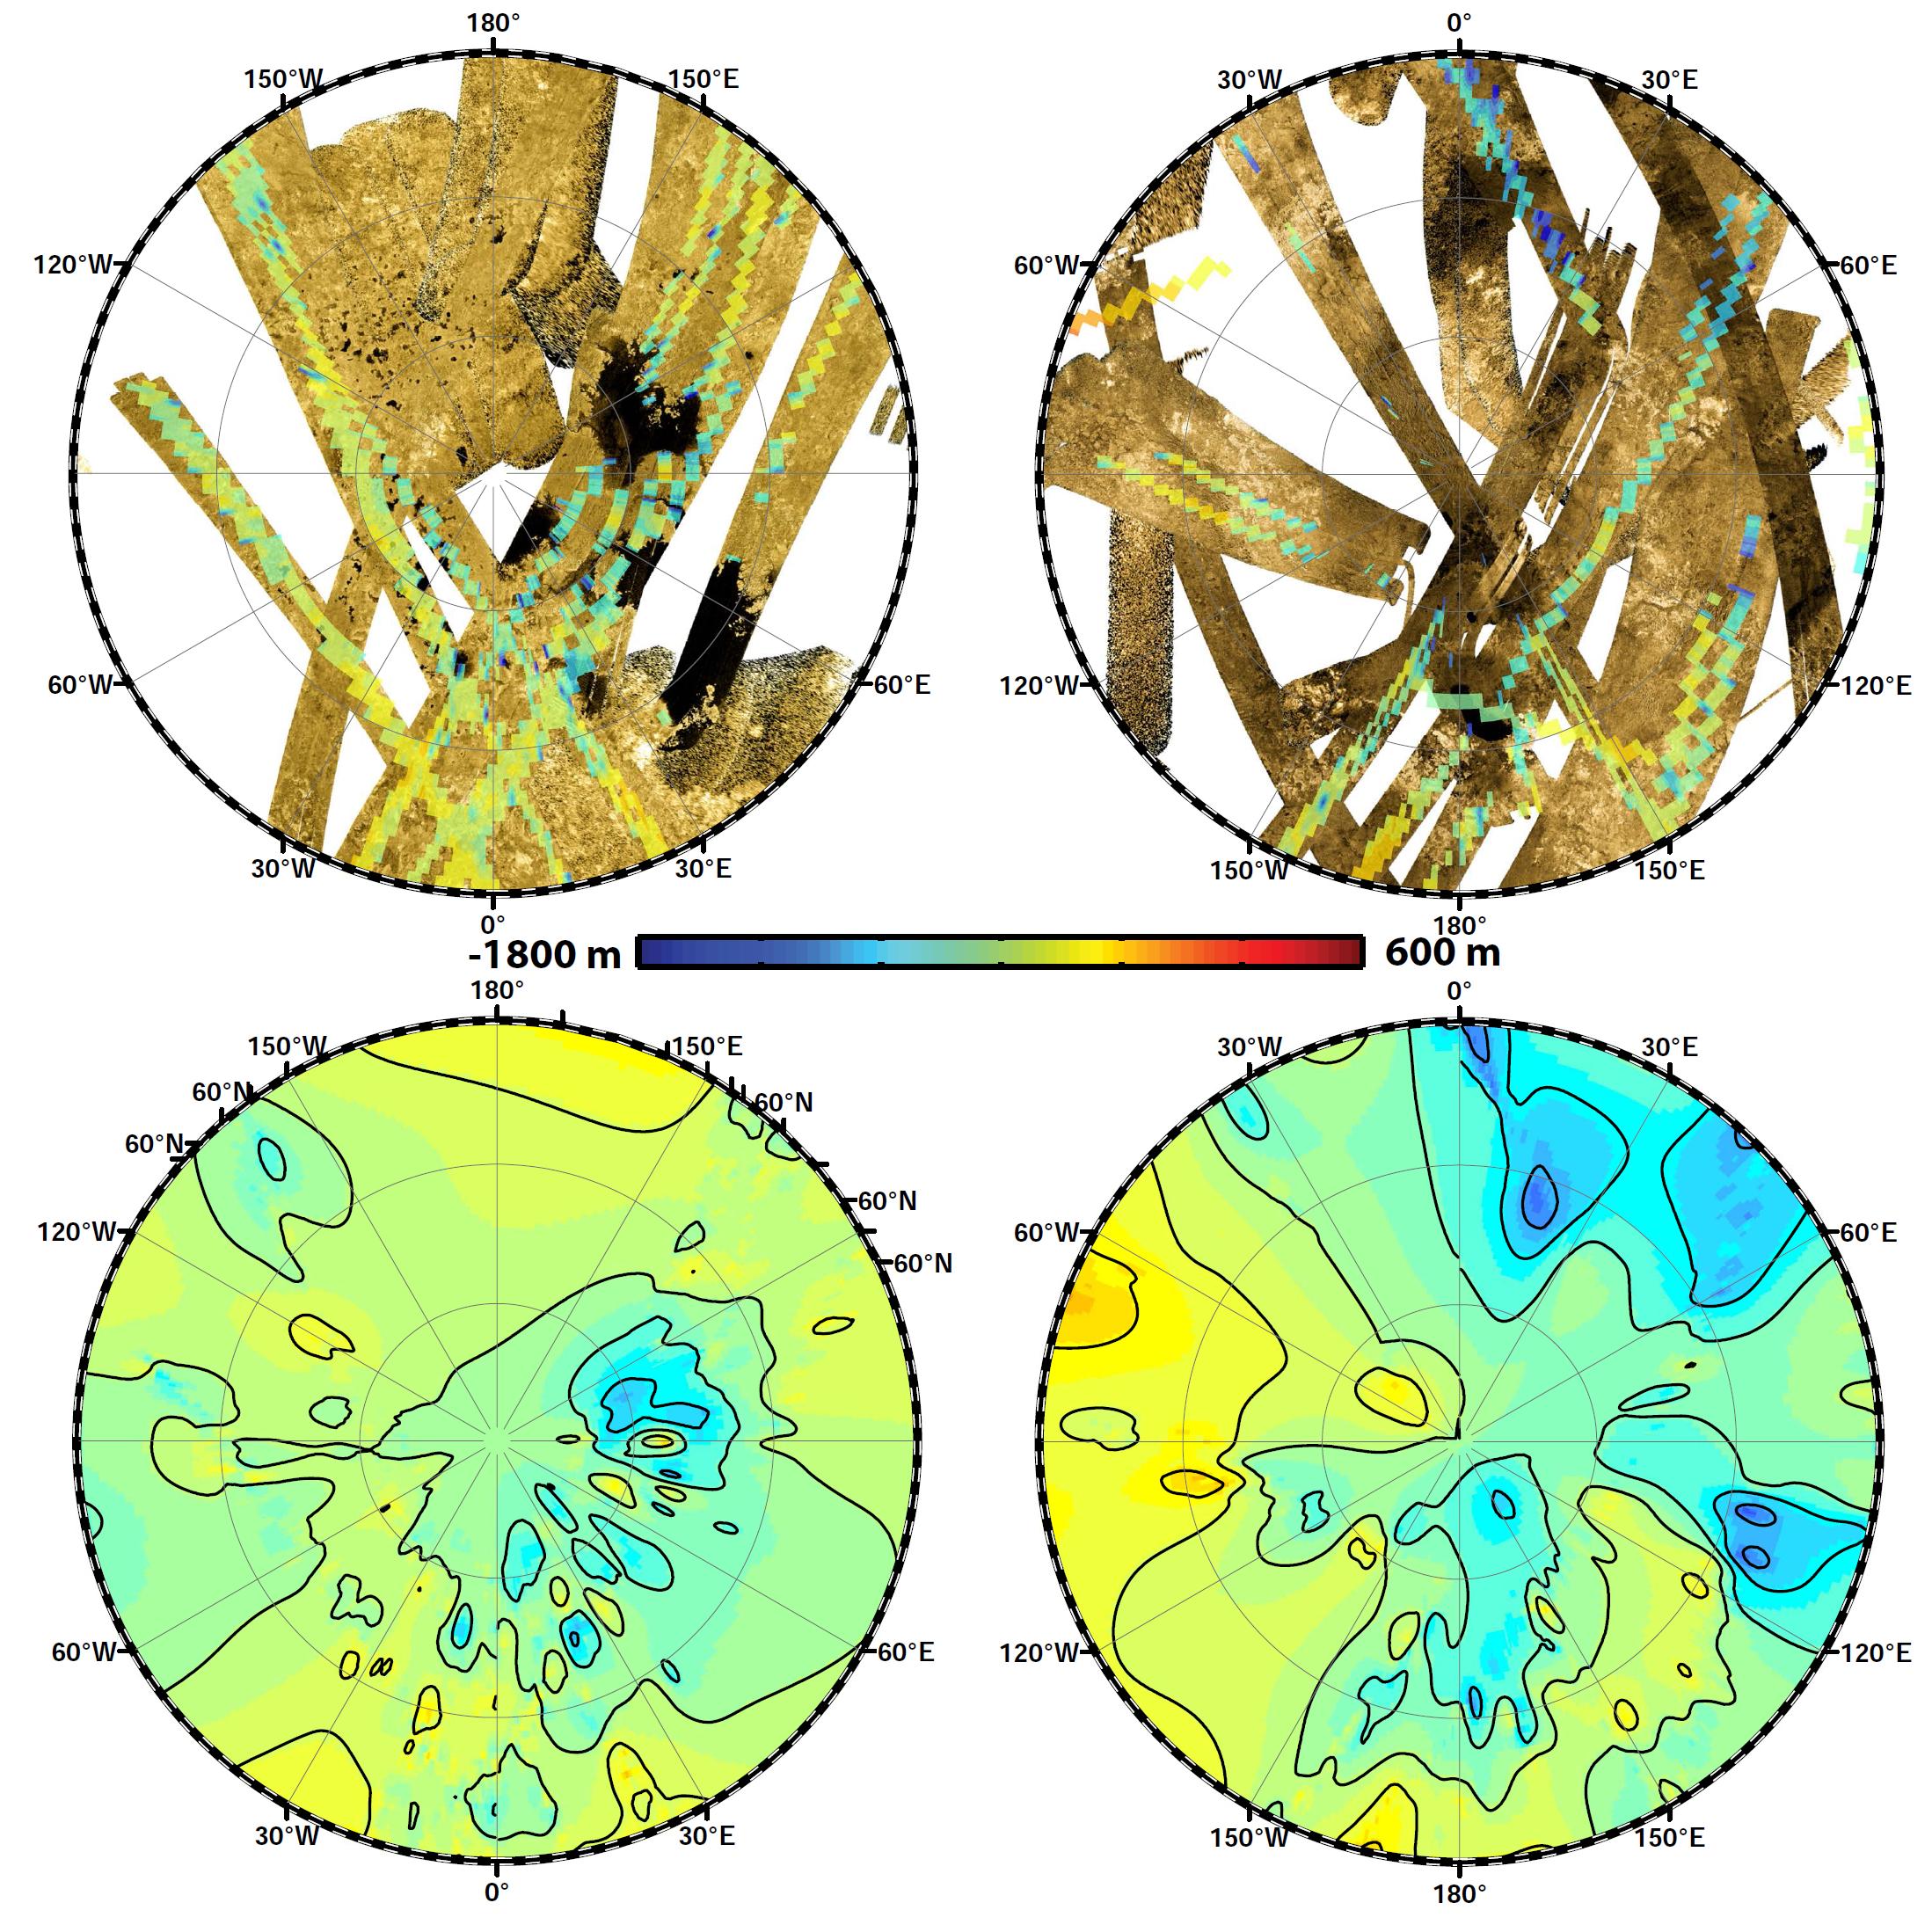
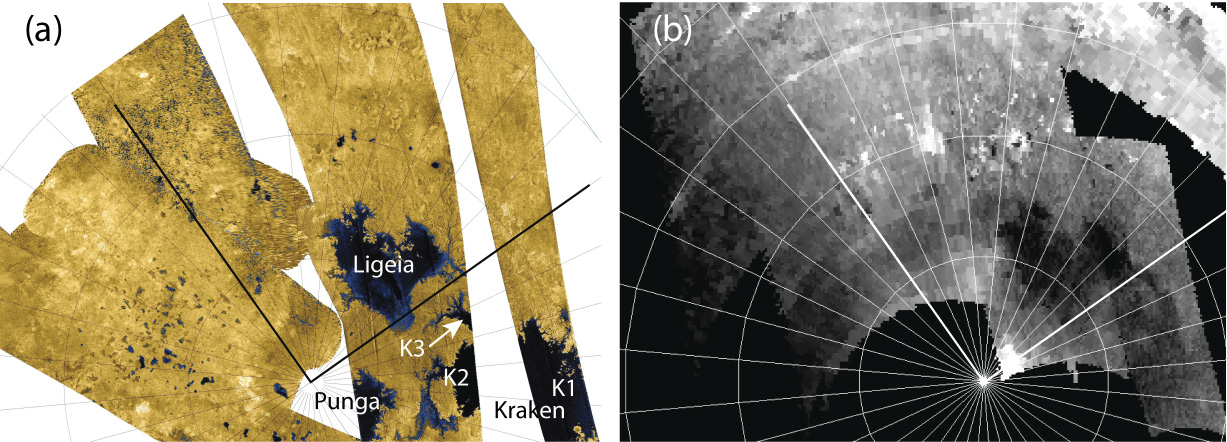
The image in the lower part of the table corresponds to the annotated version of the mosaic shown in the upper part of the table. One can notice 
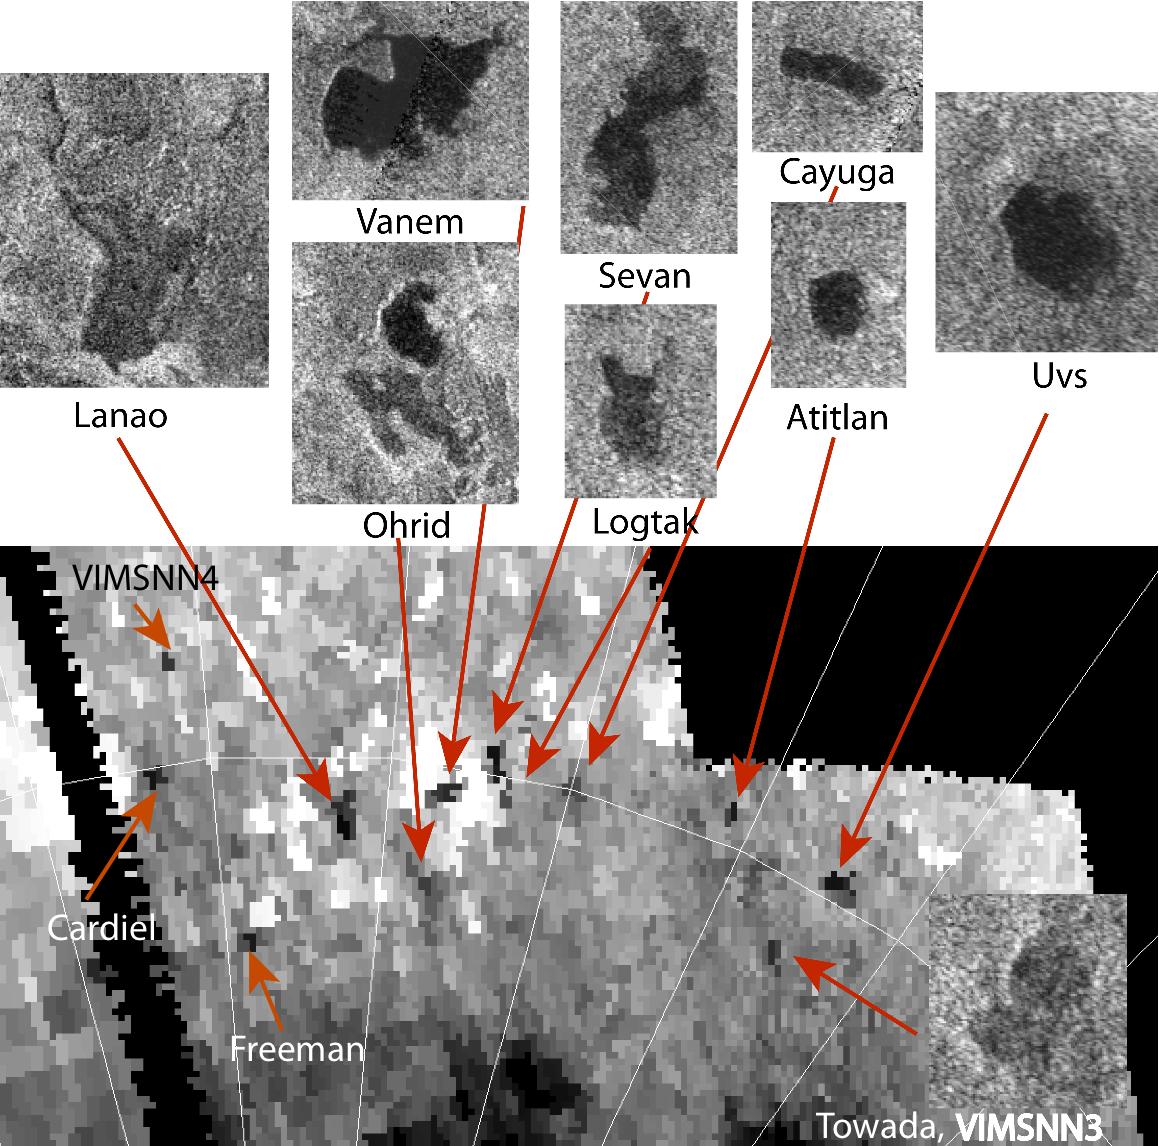
the largest sea of Titan known as Kraken Mare in the upper right part of the disc. One can also observe Ligeia Mare and Punga Mare close to the north pole of the moon, represented by a red cross. Jingpo Lacus found below Kraken Mare is among the largest bodies of liquids on the surface of the north polar area. Most pools of liquids on the Orange Moon appear to 
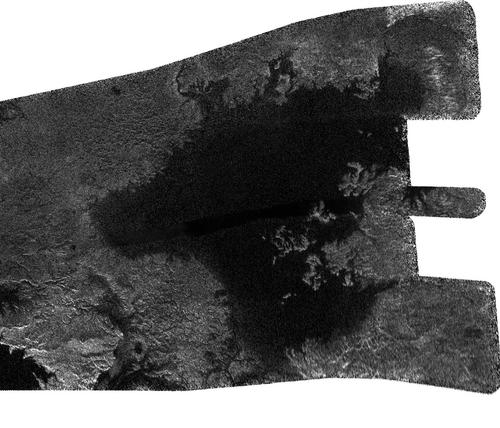
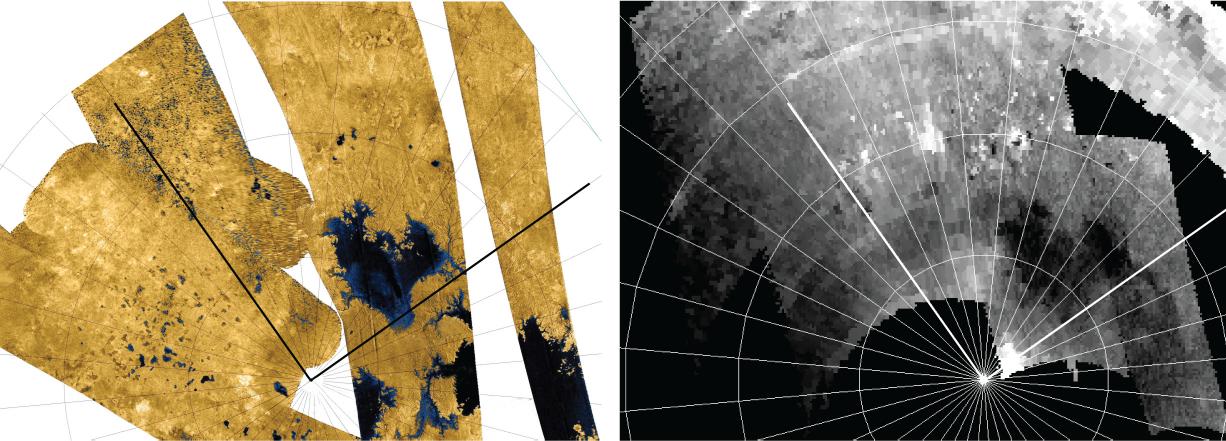
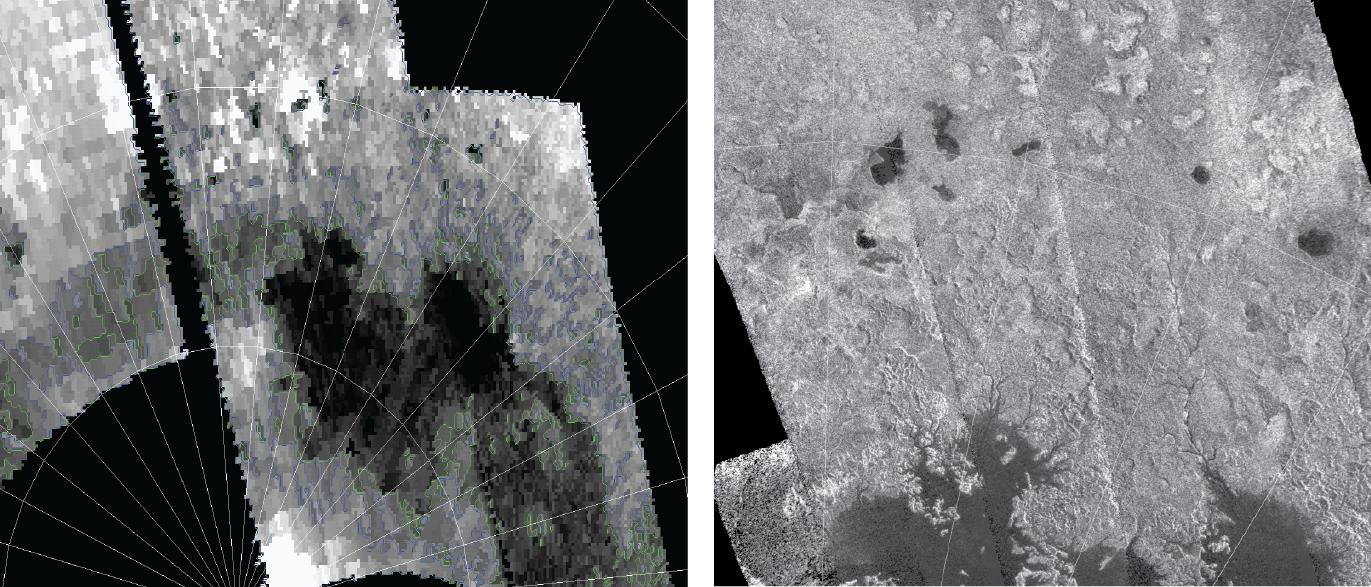
be concentrated in the north polar region. The strip in the annotated 
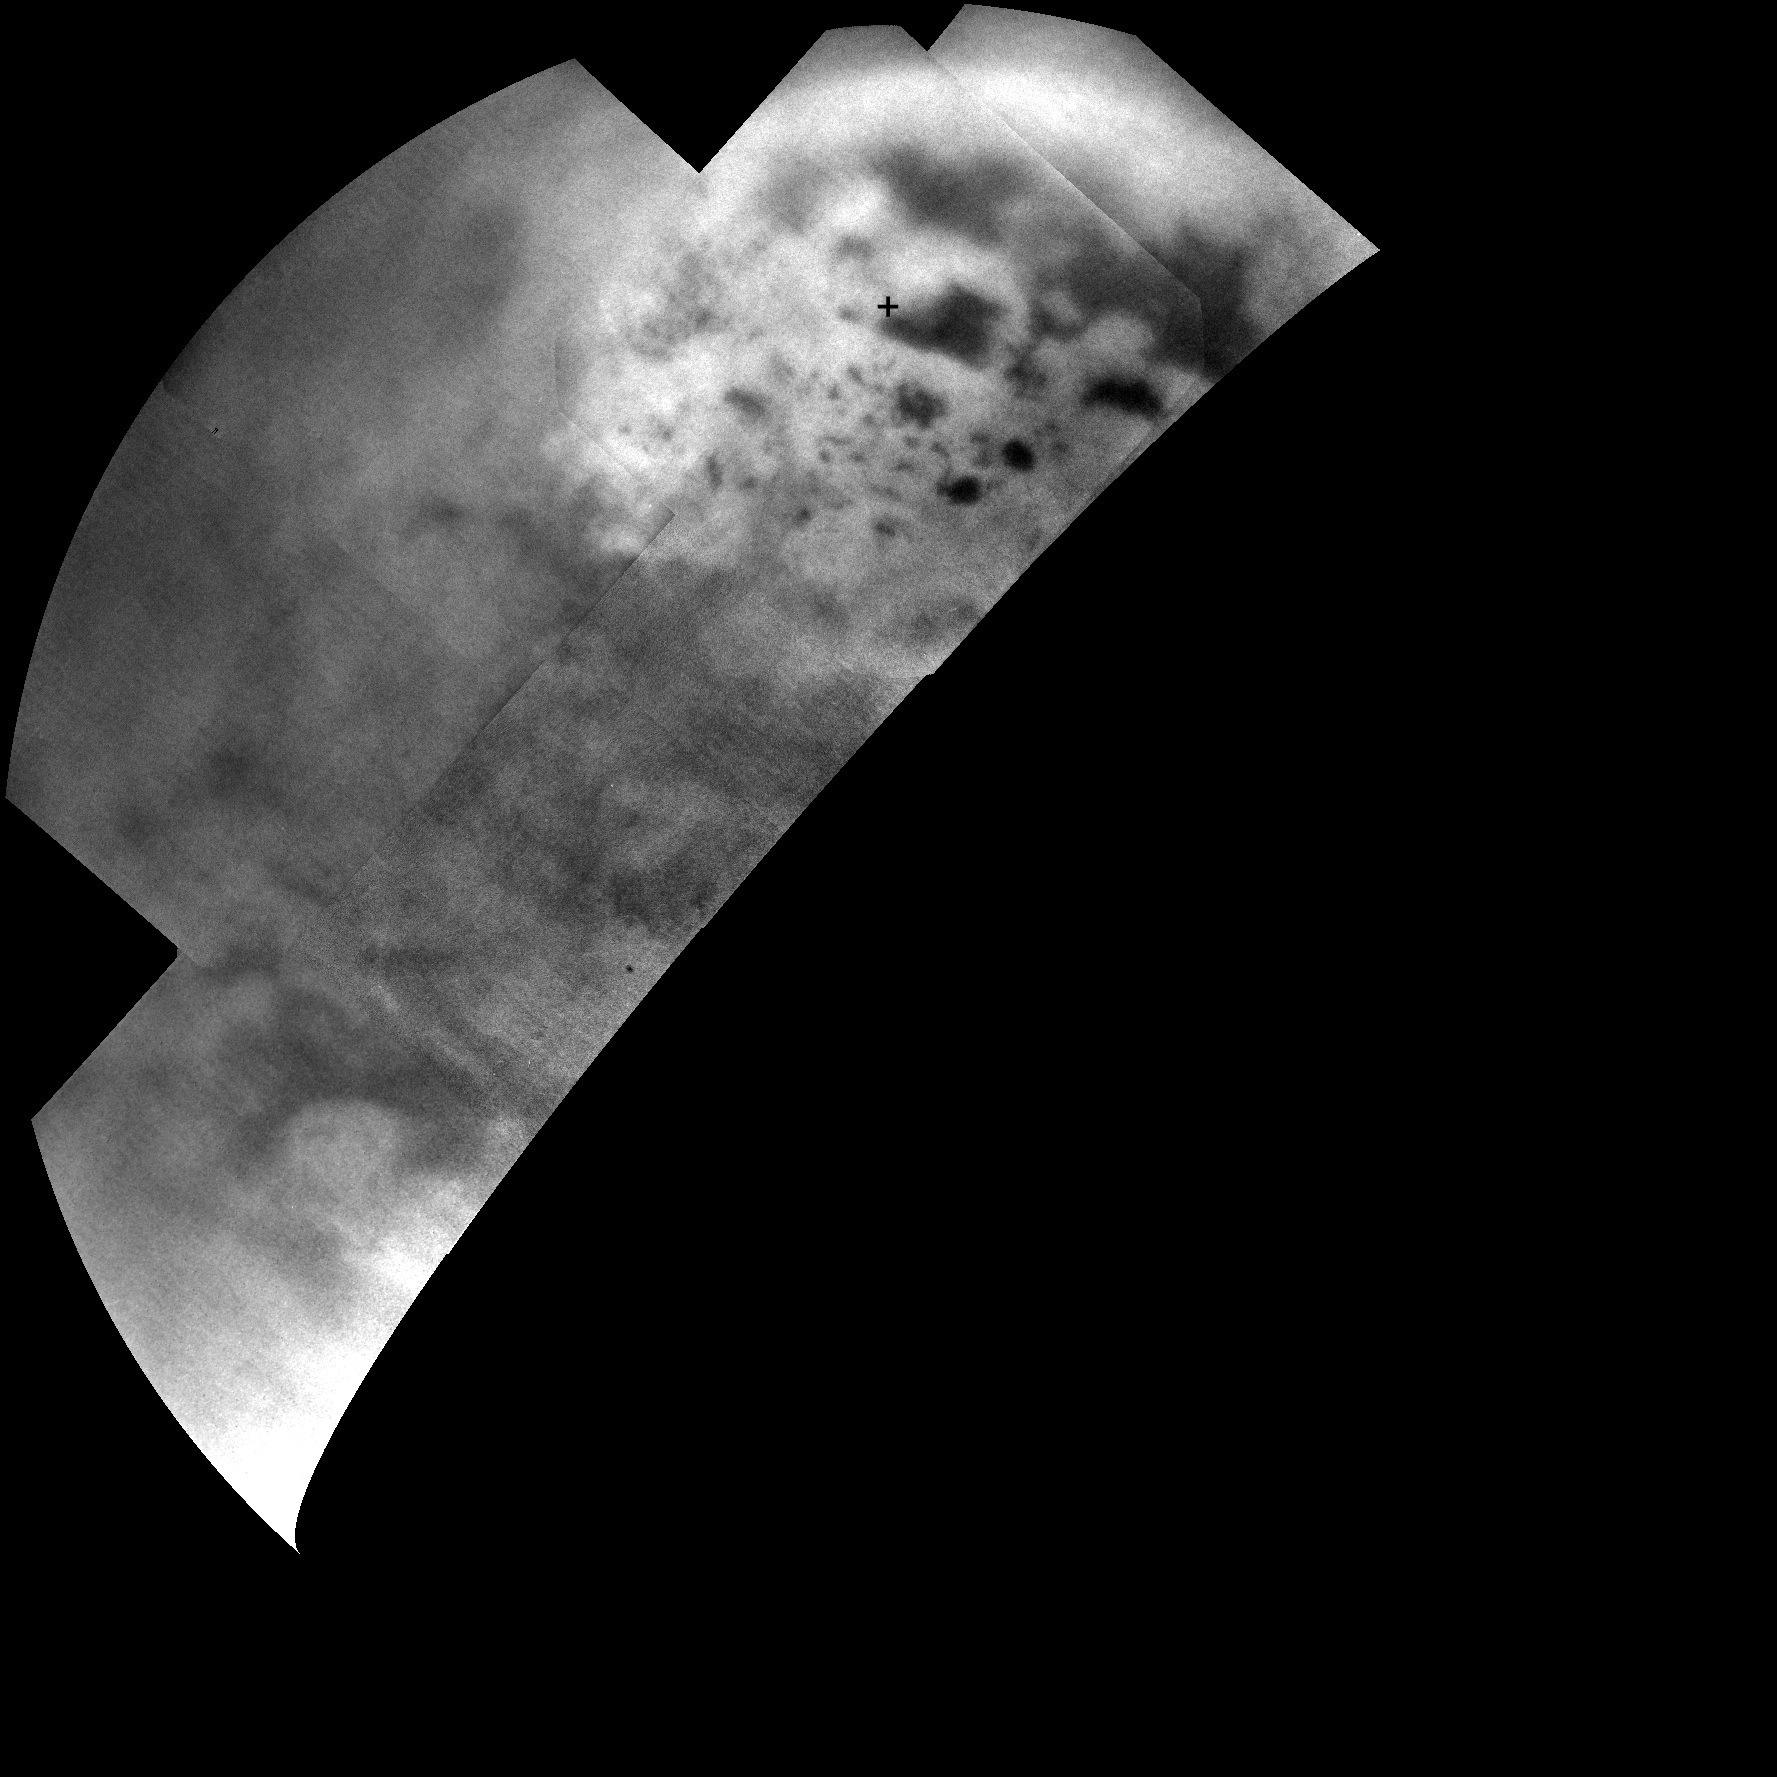
version of the mosaic corresponds to a high-resolution portion of the landscape.
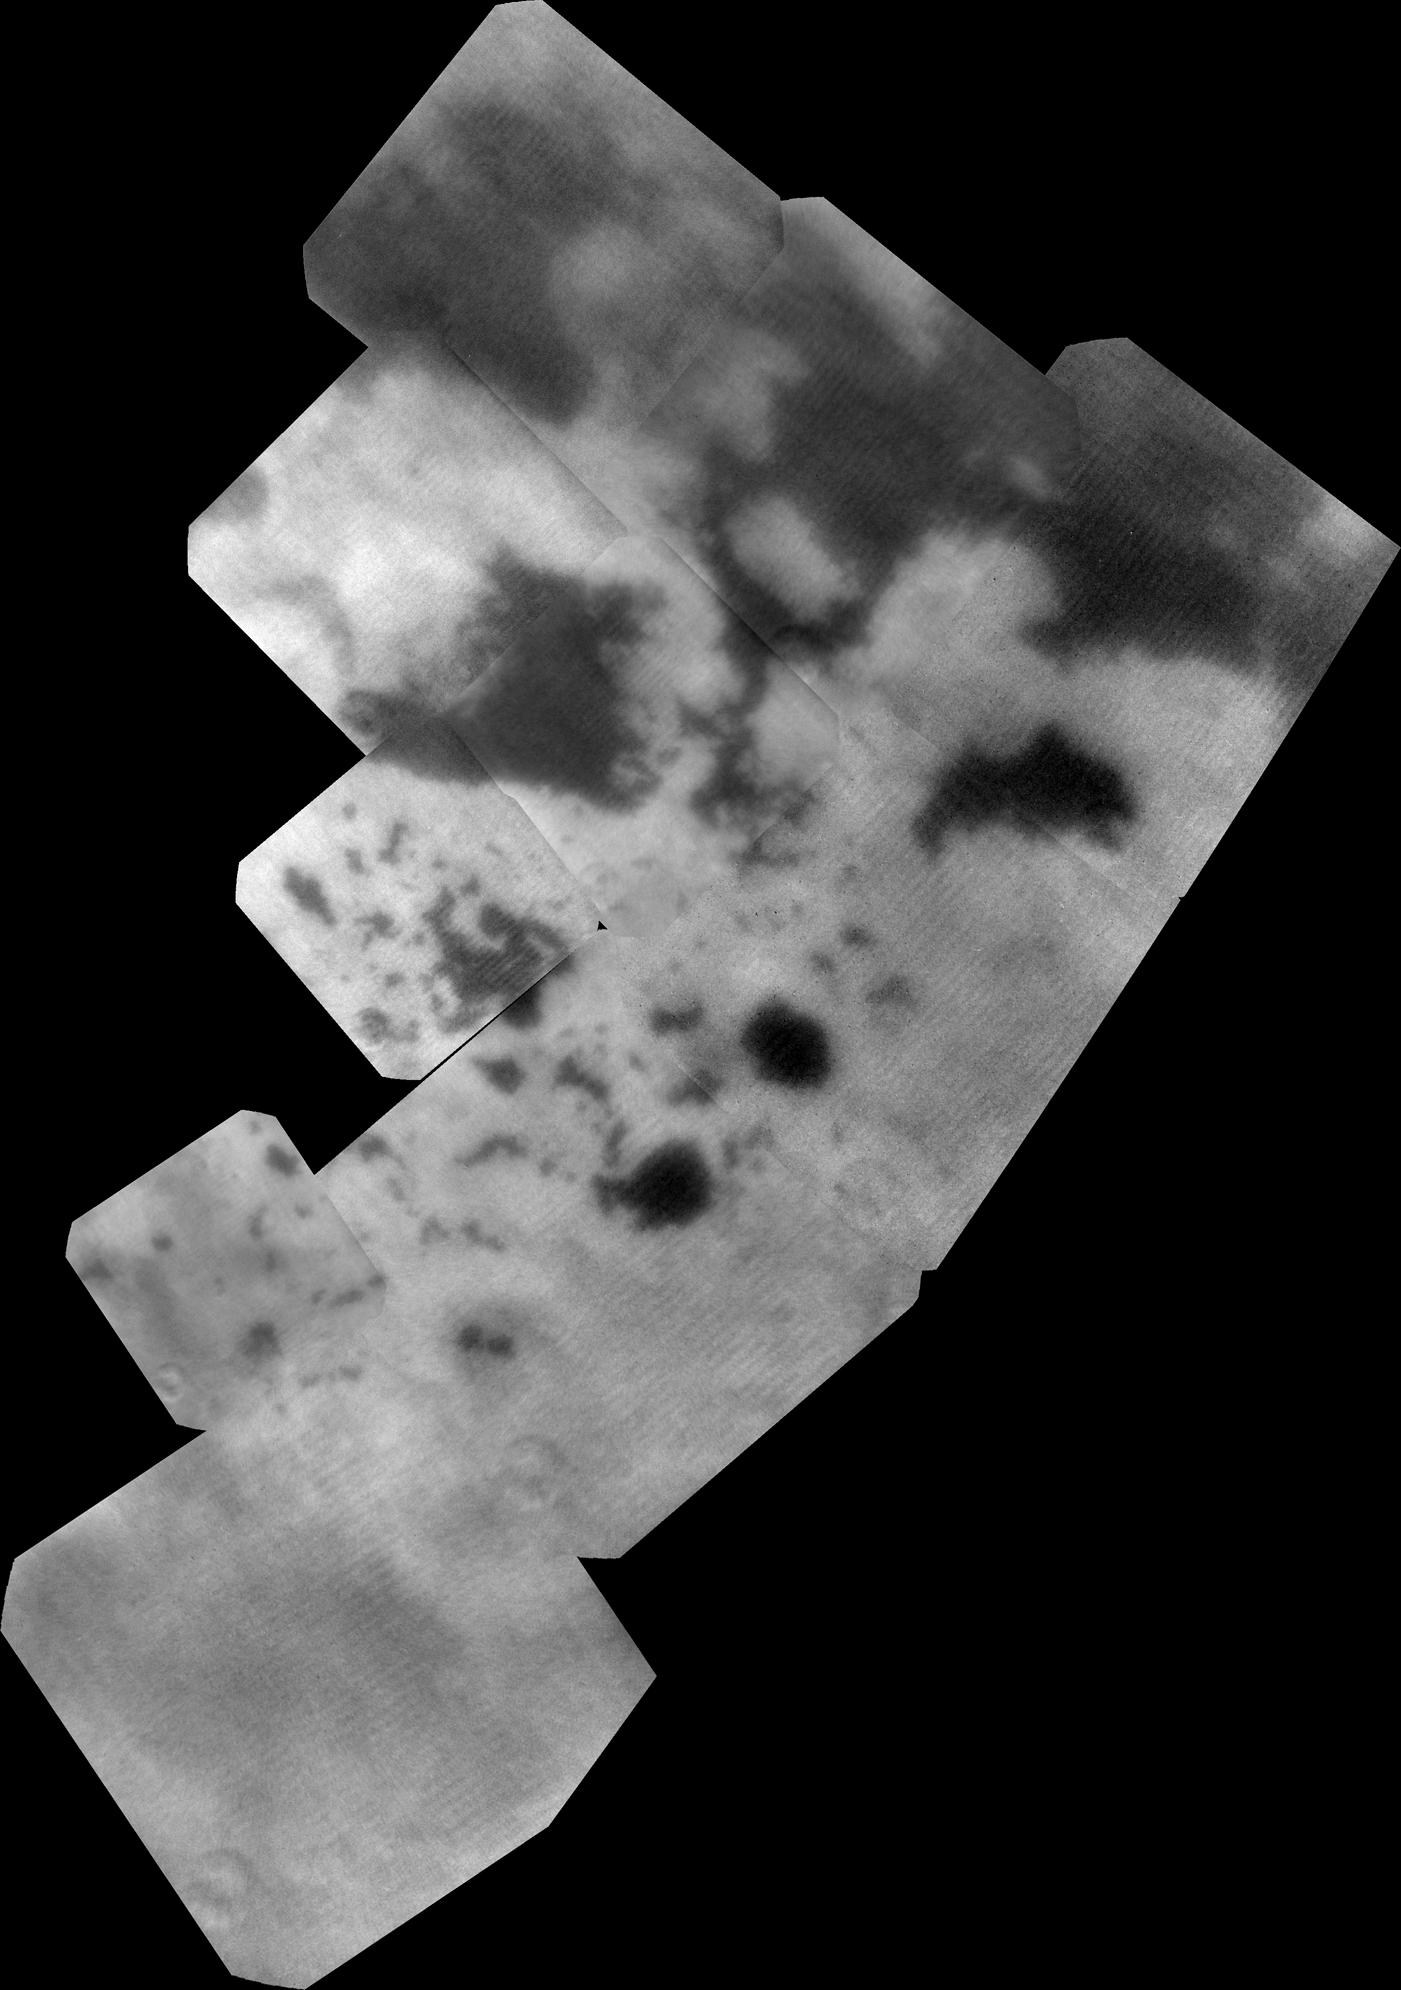
The mosaic was constructed on the basis of infrared or near-infrared data obtained with the Visual and Infrared Mapping Spectrometer of the Cassini probe during a close flyby of the Opaque Moon on September 12, 2013. The researchers converted near-infrared data into colors of the visible spectrum to generate this artificial mosaic. They associated the red color with a wavelength of 5 microns which is 10 times longer than visible light. They associated the green color with a wavelength of 2 microns which is four times longer than visible light. And they associated the blue color with a wavelength of 1.3 microns which is 2.6 times longer than visible light. The resolution on this map is heterogeneous, varying depending on when each cube of data was taken, but the best surface resolution is 2 miles or 3 kilometers per pixel.
The differences in colors on the surface of this globe bring clues regarding the nature of the topography, the ground or the surface. The dark areas which appear roughly uniform are associated with lakes or seas. The orange regions seem to represent dried-up lakes or seas. One can notice in particular a dark patch surrounded by an orange area. The researchers suggest that the orange portions may represent evaporite, the equivalent of salt flats on our planet. The evaporated compounds may be organic molecules finding their origin in Titan's haze compounds that once dissolved in the liquid primarily made of ethane and methane. One can notice the contrast between the orange areas and the typical greenish areas likely dominated by water ice.
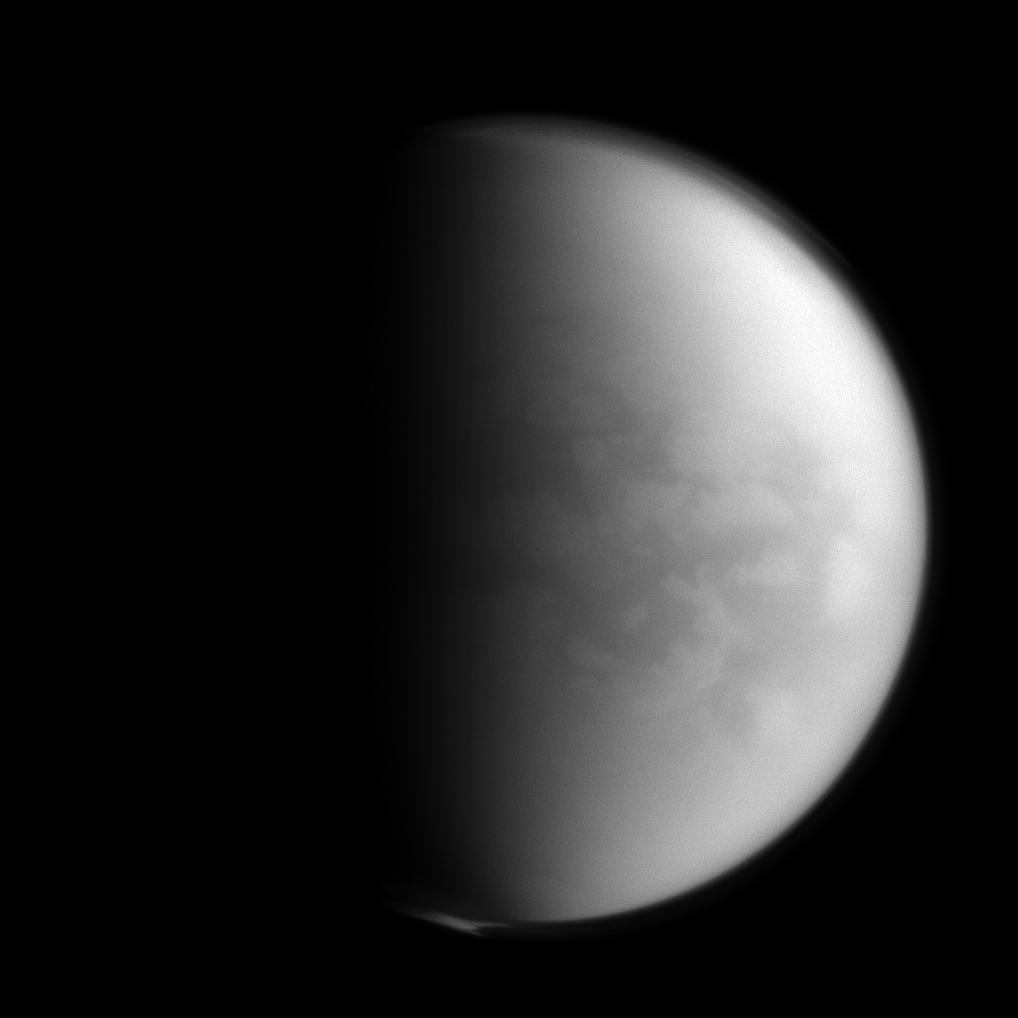
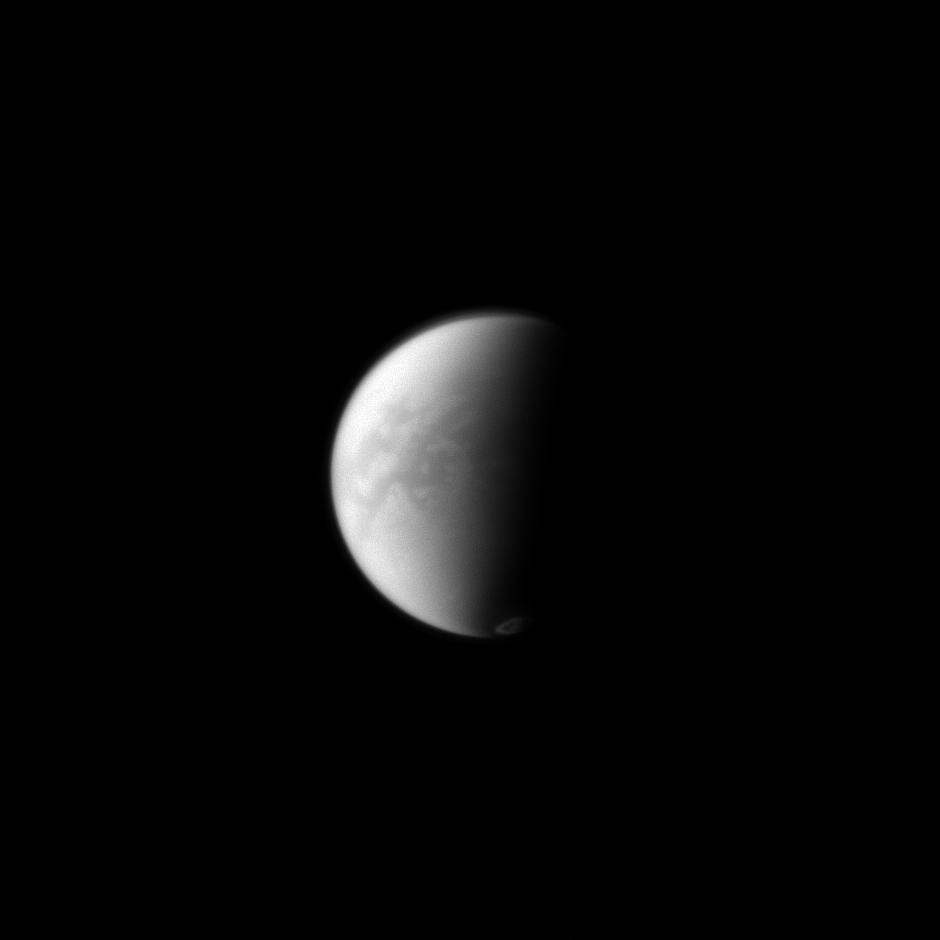
The Summer season in the northern hemisphere is now approaching and the solar radiations are beginning to better illuminate the north polar region. The viewing geometry of the flyby of September 12, 2013 was better than that of the past flybys during which the VIMS had only been able to obtain distant, oblique or partial images of the north polar region. When the Cassini probe reached the Saturn System in 2004, the north polar region of Titan was in the darkness of the Winter season. The midnight Sun is now arriving. The thick cap of haze which had been observed a few years ago over the north polar region has apparently dissipated and no signs of storms, rain or cloud activity were observed during the September 12, 2013 flyby. Will the lakes and seas start to evaporate during the next Summer season in the northern hemisphere ?

Image Credit: NASA/JPL-Caltech/University of Arizona/University of Idaho.


The image of Titan's disc above, obtained with the ISS Narrow-Angle Camera of the Cassini spacecraft on April 13, 2013 reveals the famous polar collar which had been clearly identified by the probe Voyager 2 and the Hubble Space Telescope. The camera is orientated toward the Saturn-facing hemisphere of the Orange Moon. North on Saturn's largest moon is up and tilted 32 degrees to the right. The image was acquired using a spectral filter sensitive to wavelengths of ultraviolet light centered at 338 nanometers. The image was captured at a distance of about 1.1 million miles or 1.8 million kilometers from the Opaque Moon and at a Sun-Titan-probe, or phase, angle of 4 degrees.
Scientists believe that the dark band surrounding the north polar region is closely related to seasonal factors. The northern hemisphere is currently experiencing the Spring season and the Summer season is approaching. Large cloud systems may take shape during the Summer season in the high latitudes of the northern hemisphere. Researchers will continue to monitor changes in the appearance of the atmosphere in order to clearly determine the cause and the evolution of that surprising atmospheric phenomenon.

Image Credit: NASA/JPL-Caltech/Space Science Institute.


The illustration above proposed by the European Space Agency reveals the steps that lead to the development of the aerosols that compose the haze of Titan's lower atmosphere. The solar radiation as well as the energetic particles coming from Saturn's magnetosphere interact with molecules and particles present in the upper atmosphere of the Opaque Moon over approximately 600 miles or 1,000 kilometers above the ground. Thus methane and nitrogen molecules present in that atmospheric area tend to be broken up resulting in the development of massive positive ions and electrons.
The electrons and the massive positive ions then drift downward and interact or recombine to form more complex molecules and in particular benzene and Polycyclic Aromatic Hydrocarbons or PAHs. PAHs are composed of carbon rings connected to hydrogen atoms and some PAHs identified in the atmosphere contain nitrogen atoms as well.
PAHs will tend to coagulate to form more complex organic molecules as they drift downward. The development of more complex molecules in the lower atmosphere is favored by the increase in the density of the air. Well below approximately 300 miles or 500 kilometers of altitude in the lower atmosphere, some carbon-based aerosols take shape on the basis of PAHs coming from higher altitudes. Those carbon-based aerosols correspond to large aggregates of atoms and molecules which form a brownish orange haze.

Image Credit: ESA/ATG medialab.


This near-infrared image of Titan's disc was taken with the ISS Narrow-Angle Camera of the Cassini probe on April 13, 2013 at a distance of about 1.117 million miles or 1.797 million kilometers from the Orange Moon. The view was obtained on the basis of a spectral filter sensitive to wavelengths of near-infrared radiation centered at 938 nanometers. The image was captured at a Sun-Titan-probe, or phase, angle of 4 degrees. The camera is orientated toward the Saturn-facing hemisphere of the Opaque Moon. North on Saturn's largest moon is up and tilted 32 degrees to the right.
The near-infrared views allow us to see through the opaque atmosphere and to identify topographic or surface features of Titan. This image clearly shows the famous dark "H" of the Fensal and Aztlan regions found at low latitudes. The radar images have shown that the dark areas located in the Tropical or Equatorial region tend to be dominated by Seif Dunes or linear and parallel dunes extending over long distances. The dunes may be shaped by prevailing winds and they may be composed of hydrocarbons or complex organic molecules resulting from rainfall, snowfall or precipitations of molecules from the Titanian haze. A bright atmospheric feature can be identified in the lower part of the disc. Is it a cyclone or a cloud formation ?

Image Credit: NASA/JPL-Caltech/Space Science Institute.


The radar image above, obtained with the Radar Mapper of the Cassini probe between February 2006 and April 2007 shows Ligeia Mare, a major lake of Titan's north polar region. The sea Kraken Mare appears to be, by far, the largest pool of liquids in the north polar region. Punga Mare is another major lake found in the high latitudes of the northern hemisphere. The lakes may be composed of a mixture of ethane and methane. Researchers predict the development of waves in the pools of liquids of the northern hemisphere as the Summer season in the northern hemisphere advances. One may start to observe hurricanes, cyclones or storms in the area in the coming years.

Image Credit: NASA/JPL-Caltech/ASI/Cornell.


The image in the upper part of the table corresponds to a false-color mosaic of Ligeia Mare, one of the largest pools of liquids found in the north polar region of the Opaque Moon Titan. This mosaic was obtained on the basis of Synthetic Aperture Radar images acquired from the Radar Mapper of the Cassini probe between February 2006 and April 2007. The areas appearing dark in this view are likely composed of liquid methane and ethane. By contrast, the areas which are tinted yellow likely correspond to solid surfaces.
The north polar region may be the dampest area of Saturn's largest moon as radar data obtained so far have revealed. Kraken Mare appears to be the largest pool of liquids on Titan. Punga Mare is another major lake of the high latitudes of the northern hemisphere. Ligeia Mare appears to be connected to Kraken Mare as some images show or suggest.
The radar data expected to be collected with the Radar Mapper of the Cassini probe on May 23, 2013 may provide us with significant clues or information on the nature of the lake, on its dynamics, on the type of waves or on the potential for waves in the area in the configuration of a stormy weather likely to occur during the Summer period of the northern hemisphere.
The radar image in the lower part of the table shows the radar view of Ligeia Mare on which the false-color mosaic was based. This image was obtained with the Radar Mapper of the Cassini probe on February 21, 2007.
 

Image Credit: NASA/JPL-Caltech/ASI/Cornell.


The image above corresponds to the first global topographic map of Saturn's largest moon Titan. This map was generated on the basis of data from the Cassini probe. Hence, scientists can use it as a 3-D tool for analysing surface features of the Opaque Moon. The researchers who created this map used a mathematical process called splining, a method consisting in using smooth curved surfaces to "join" the areas between grids of existing topography profiles taken by the Radar Mapper of the Cassini spacecraft.
In other words, this technique produces some topographic extrapolations to evaluate the elevation level of areas where there is no radar data available. The outcome is consistent with the current knowledge according to which the polar regions are "lower" than the low-latitude areas or than the areas around the equator, for instance. The analysis upon the way the regions are topographically connected allows researchers to add new layers to their study of the ground and to better model the dynamics of the rivers, the way the rivers flow as well as the seasonal distribution of the methane rainfall on the globe. The radar data used to produce this map were obtained between 2004 and 2011.

Image Credit: NASA/JPL-Caltech/ASI/JHUAPL/Cornell/Weizmann.


The two global maps above show topographic or surface features of Saturn's largest moon Titan. The graphic in the lower part of the mosaic corresponds to the first global, topographic map of the Orange Moon. This map was produced on the basis of data from the Cassini probe and on the basis of a mathematical process called splining. This technique incorporates smooth curved surfaces to "join" the areas between grids of existing topography profiles acquired by the Radar Mapper of the Cassini spacecraft.
In the map of the upper part of the mosaic, radar data from the Cassini probe are incorporated into the view and the areas where there isn't any radar data are covered with infrared or near-infrared images obtained with the Visual and Infrared Mapping Spectrometer of the Cassini probe. The radar images are covered here with gold and black colors. The black colors indicate low-albedo areas whereas the yellow areas have a higher albedo. The lakes found in the polar regions appear dark and relatively uniform. The radar data taken so far from the Radar Mapper of the Cassini probe represent almost half of Titan's surface.
Narrow strips of rainbow colors were also incorporated into the gold or radar areas to reveal where height or elevation data have been obtained. Those elevation data are inserted over a blue-toned, near-global map of infrared color from the Visual and Infrared Mapping Spectrometer instrument of the Cassini probe.
The map in the lower part of the mosaic reveals the new topography map, with contour lines incorporated at 656 feet or 200 meters apart in elevation. One can notice the high-elevation areas in the low latitudes and four prominent mountains. One can also observe the south polar depressions as well as a dark region at 50 to 65 degrees south latitude and 0 to 60 degrees east longitude which coincides with a major depression. The VIMS and radar data were taken from the Cassini probe from 2004 to 2011.

Image Credit: NASA/JPL-Caltech/ASI/JHUAPL/Cornell/Weizmann.


The images above correspond to polar maps of Saturn's largest moon Titan. The maps represent the first global, topographic mapping of the Opaque Moon, on the basis of data from the Cassini probe. To generate these maps, researchers resorted to a mathematical process called splining, which incorporates smooth curved surfaces to "join" the areas between grids of existing topography profiles taken by the Radar Mapper of the Cassini spacecraft.
The images in the lower part of the mosaic correspond to topography maps in stereographic projection of the polar regions of the Orange Moon. The view in the lower left part of the mosaic unveils the topography of the north polar region whereas the view in the lower right part of the mosaic shows the topography of the south polar region.
The images in the upper part of the mosaic show the maps of the same regions with radar data from the Cassini probe incorporated into the maps. The 2-D radar data appear here in gold and black, with topography data color-coded by elevation. The blue areas are lower in elevation than the yellow or red areas.
The views in the lower part of the mosaic reveal the new topography maps, with contour lines incorporated at 656 feet or 200 meters apart in elevation. One can notice, in particular, deep basins at 72 degrees south latitude and 20 degrees east longitude, and a wider basin at 68 degrees south latitude and 105 degrees east longitude. The pools of liquids tend to be found in lower elevation areas.

Image Credit: NASA/JPL-Caltech/ASI/JHUAPL/Cornell/Weizmann.


The mosaic above reveals a multitude of high-latitude lakes in the northern hemisphere of Saturn's largest moon Titan. The mosaic was constructed on the basis of radar images and VIMS images from the Cassini probe. The Visual and Infrared Mapping Spectrometer portion of the mosaic represents the view located in the lower part of the mosaic. The VIMS views were obtained in 2010. The insets which provide topographic information on specific areas of the VIMS view are composed of radar images obtained in 2007. The red arrows match the presumed lakes in the radar view with the corresponding lakes in the VIMS view.
Three new small lakes, 100 to 300 square miles or a few hundreds of square kilometers in surface area, Cardiel, Freeman and a lake currently designated as VIMSNN4 can be noticed in the region in the VIMS image. Those lakes hadn't been noticed in the previous radar views. Towada or VIMSNN3, a dark patch located in the right part of the VIMS view, is a lake which had originally been observed in radar views. Researchers try to determine brightness variations or changes in surface area of the dark patches to infer changes in the dynamics or in the volume of the lakes over time. As the Summer season approaches in the area, some lakes or seas may see their level progressively diminish up to the end of the Summer season in the northern hemisphere.

Image Credit: NASA/JPL-Caltech/University of Arizona.


The image in the upper part of the table corresponds to a mosaic revealing the north polar area of Saturn's largest moon Titan. The left image, which has been colorized, is constructed on the basis of radar images obtained from the Radar Mapper of the Cassini probe. The right image, which corresponds to the same area, was captured with the Visual and Infrared Mapping Spectrometer (VIMS) of the Cassini probe. The mosaic in the lower part of the table corresponds to the annotated version of the previous mosaic.
The relatively dark and uniform patches in the radar view and in the near-infrared view correspond to lakes or seas. One can clearly notice the famous north polar lake Ligeia Mare as well as a portion of the famous sea Kraken Mare in the lower part of the radar view. Ligeia Mare appears to be approximately 50,000 square miles or 125,000 square kilometers in surface area. Thus, Ligeia Mare is larger than any North American lake. The radar mosaic only shows portions of the sea Kraken Mare and the labels K1, K2 and K3 indicate those portions of the body of surface liquids. Those portions appear interconnected in the VIMS or near-infrared image.
Some dark areas may be swampy. The nature of the liquids filling the lakes or seas is relatively mysterious but the liquids may be composed of a mixture of liquid ethane and liquid methane. A complex network of rivers connected to the lakes or seas can also be observed. Kraken Mare and Ligeia Mare may be interconnected via rivers or subsurface channels as both views suggest.

Image Credit: NASA/JPL-Caltech/University of Arizona.


This mosaic of images reveals the area of the famous north polar lake Ligeia Mare on Saturn's largest moon Titan. The left view in the upper part of the table is composed of images acquired from the Visual and Infrared Mapping Spectrometer instrument of the Cassini probe in June 2010. The right view in the upper part of the table which also shows the Ligeia Mare area corresponds to a mosaic of radar images captured from the Radar Mapper of the Cassini spacecraft in April 2007. The mosaic in the lower part of the table corresponds to the annotated version of the upper mosaic.
One can clearly notice a relatively dark and uniform area both in the VIMS image and in the radar image. This dark area represents Ligeia Mare which may be composed of a mixture of liquid ethane and liquid methane. Several small dark patches can also be identified in both views. Those dark patches also correspond to lakes.
Ligeia Mare may be the second largest body of surface liquids in the high latitudes of the northern hemisphere. Its size is estimated at about 50,000 square miles or 125,000 square kilometers in surface area.
In the annotated version of the mosaic, three new lakes are labeled as Freeman (VimsNN1), Cardiel (VimsNN2) and VIMSNN4. Those lakes which can be observed at the top left and middle right of the VIMS image are approximately 100 to 300 square miles or a few hundreds of square kilometers. They were first identified in the Visual and Infrared Mapping Spectrometer views. One can also identify the small lake Towada labeled as VimsNN3 in the VIMS view. This lake was first observed in radar images. Towada can be seen in the middle right area of the radar view. The small lakes appeared to remain relatively stable between 2007 and 2010.

Image Credit: NASA/JPL-Caltech/University of Arizona.


This view of Titan's disc obtained from the Narrow-Angle Camera of the Cassini probe on January 5, 2013 reveals the dark region of Senkyo. The image was acquired at a distance of about 750,000 miles or 1.2 million kilometers from the Orange Moon, using a spectral  filter sensitive to wavelengths of near-infrared radiation centered at 938 nanometers. The view was captured at a Sun-Titan-probe, or phase, angle of 79 degrees. The illuminated terrain observed here is on the Saturn-facing hemisphere of the Opaque Moon. North is toward the top of the disc and rotated 18 degrees to the right.
This near-infrared view allows us to discern landscape features such as the dark region of  Senkyo as well as the upper layers of the atmosphere or the bright south polar vortex. The south polar cyclone may have started developing quite recently. The dark areas observed in the low latitudes of the moon appear to be dominated by Seif Dunes or linear and parallel dunes extending over long distances. The dunes may be composed of solid hydrocarbon particles which likely originate in the complex haze of Titan's atmosphere.

Image Credit: NASA/JPL-Caltech/Space Science Institute.


The image above shows a crescent of Saturn's largest moon ,Titan revealing, in particular, the dark region of Senkyo near the equator and the bright vortex of clouds hovering over the south polar region just to the right of the terminator on the dark side of the Orange Moon. The bright vortex which unveiled a yellowish appearance in a recent color image appears to be relatively stable over time. This mass of swirling gas which can be compared to a cyclone or a hurricane may be closely related to seasonal factors and may continue to grow as the Winter season approaches and develops in the southern hemisphere in the coming years.
The illuminated terrain, in this view, appears on the Saturn-facing hemisphere of the Opaque Moon. North appears in the upper part of the image and is rotated 11 degrees to the left. The view was obtained with the ISS Narrow-Angle Camera of the Cassini probe on September 20, 2012 using a spectral filter sensitive to wavelengths of near-infrared radiations centered at 938 nanometers. The image was acquired at a distance of about 1.8 million miles or 2.9 million kilometers from the Orange Moon and at a Sun-Titan-probe, or phase, angle of 84 degrees.

Image Credit: NASA/JPL-Caltech/Space Science Institute.


This mosaic of radar images obtained from the Radar Mapper of the Cassini probe unveils two particular craters on Saturn's largest moon Titan. The crater on the left of the mosaic corresponds to Sinlap and the crater on the right of the mosaic represents Soi. The boundaries of Sinlap appear to be well defined as opposed to the boundaries of Soi which seem to be highly eroded or covered with sand or a soft layer. Sinlap appears to be a relatively fresh or recent crater since the erosion in the area seems relatively limited. The depth-to-diameter ratio of Sinlap is close to what we observe on Jupiter's largest moon Ganymede. By contrast, the depth of Soi is relatively shallow compared to similar craters on the giant moon of Jupiter Ganymede. Soi and Sinlap are both approximately 50 miles or 80 kilometers in diameter. The radar image of Sinlap was acquired on February 15, 2005. The radar view of Soi corresponds, in fact, to a mosaic of two images obtained on May 21, 2009 and July 22, 2006.

Image Credit: NASA/JPL-Caltech/ASI/GSFC.


Can we encounter blocks of hydrocarbon ice floating on the lakes, seas or rivers of Saturn's largest moon Titan ? The analysis of radar images showing some north polar lakes suggests the potential presence of ice blocks floating in some portions of the lakes. The radar image above taken with the Radar Mapper of the Cassini probe on May 22, 2012 shows that the dark lakes are not perfectly uniform and that significant variations in brightness or reflectivity can be discerned within the lakes.
In other words, the radio waves sent from the spacecraft can be reflected by the lakes in different ways due to depth variations, due to variations in the composition of the lakes or due to the presence of ice blocks floating on the lakes. The ice blocks may be relatively bright and reflective. The blocks of hydrocarbons may appear orange or brownish rather than white.
A smooth or flat lake may appear darker than a lake with strong waves. In the radar view above, the lake in the lower part of the image seems to be completely filled with liquids and seems to be relatively deep as opposed to the lake above it which seems to be partially filled with liquids. Some bright spots within that lake may be the outcome of the presence of hydrocarbon ice floating on the lake.
Two areas in the top right portion of the image seem to correspond to areas representing ancient lakes since they appear relatively bright and uniform. Are they composed of mud or are they completely dry ? Are there significant variations in the depth of the lakes depending on seasonal changes ?
The lakes appearing in the view are each approximately 35 to 45 kilometers across or 22 to 30 miles across. Their size can be compared to the size of Lake Tahoe on the California-Nevada border. The image was acquired from the radar instrument of the spacecraft at a scale of approximately 350 meters or 1,100 feet per pixel. The view is shown in polar stereographic projection with a logarithmic stretch.

Image Credit: NASA/JPL-Caltech/ASI/Cornell.


Titan Images 2012

Titan Images 2011
Titan Images 2010
Titan Images 2009
Titan Images 2008
Titan Images 2007
Titan Images 2006
Titan Images 2005, 2004

Back to main page