Titan Images 2008
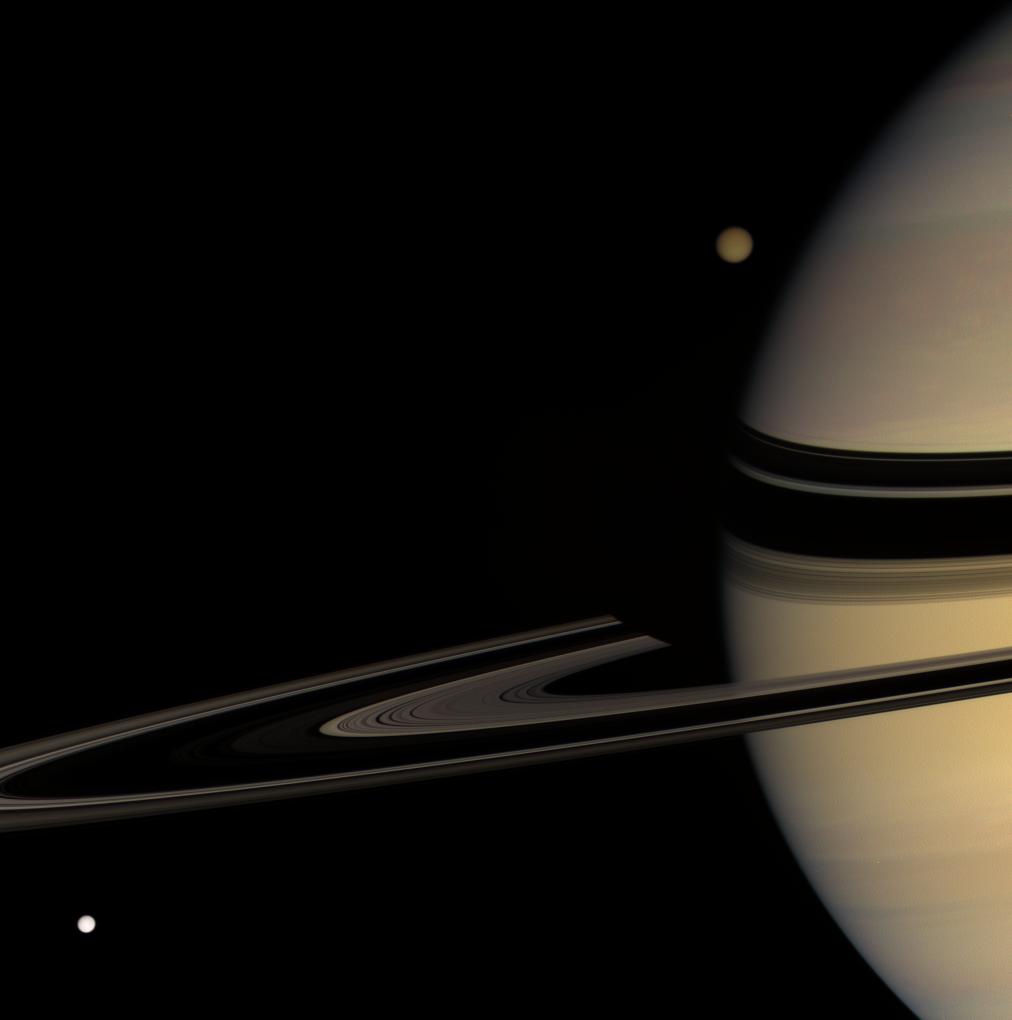 |
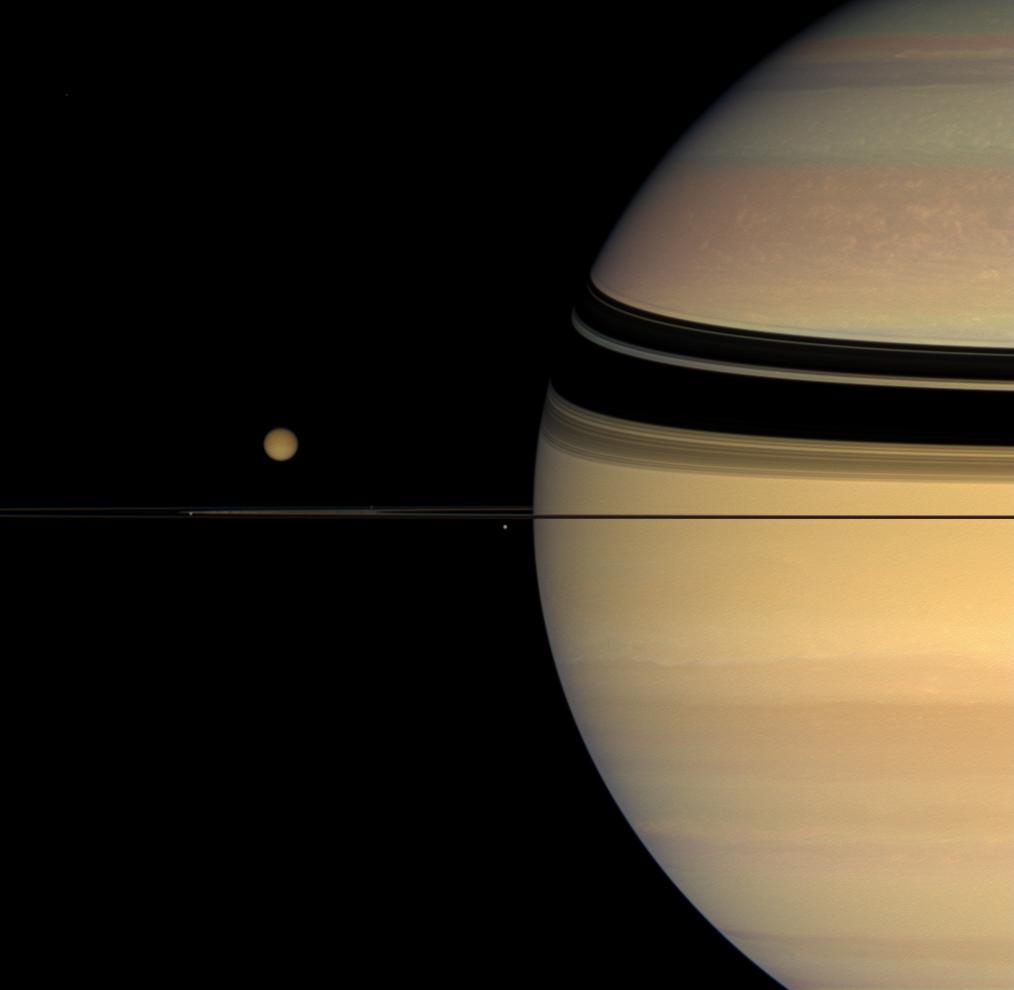
This natural color view showing
Saturn, Titan and Tethys turns out to be one of the most fascinating
images of the Saturn system in 2008. The image was generated with the
Cassini probe wide-angle camera by combining images taken using red,
green and blue spectral filters. The view was obtained on January 30,
2008 at a distance of about 1.3 million kilometers ( 800,000 miles
) from Saturn. The camera focuses on the unilluminated side of the
rings from around 3 degrees above the ringplane. There is a "subtle
shadow game" between Saturn and its rings: one can notice, notably,
that Saturn's shadow darkens the far arm of the rings close to the
planet's limb. Image source: NASA, JPL |
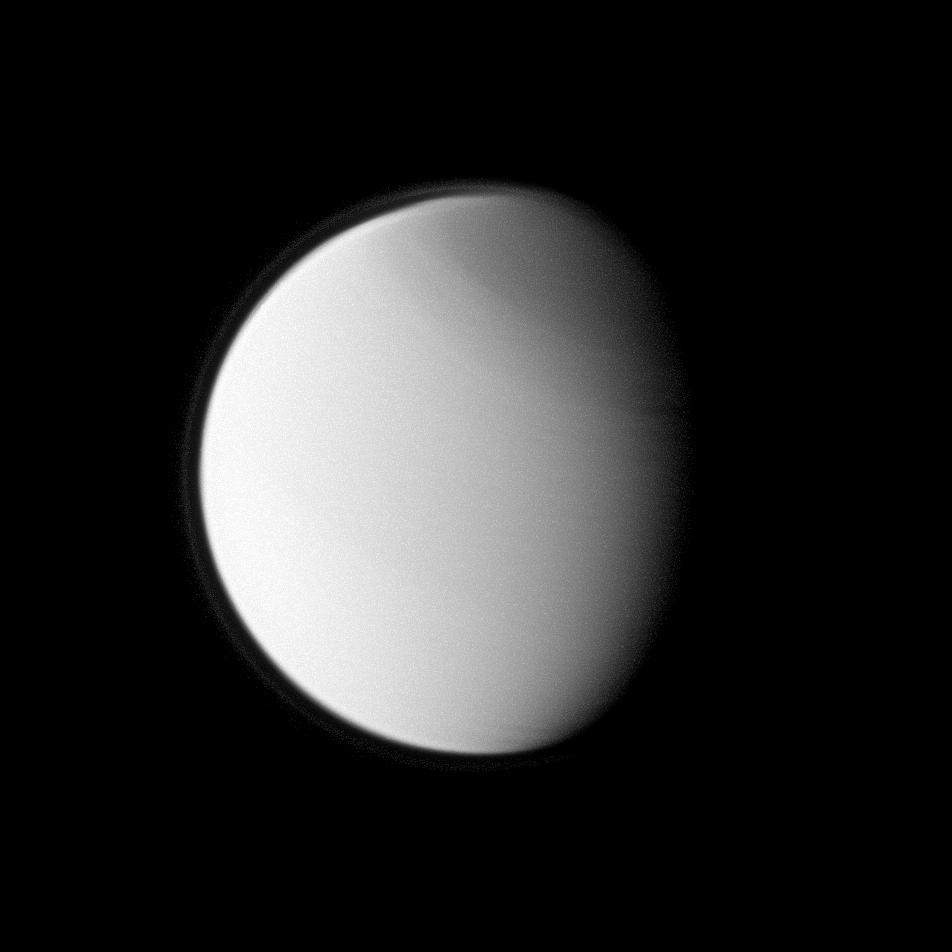 |
This ultraviolet view of Titan,
released on December 31, 2008, was captured with the Cassini probe
narrow-angle camera using a combination of spectral filters sensitive
to wavelengths
of
polarized
ultraviolet
light centered at 338 nanometers. The image was taken at a distance
of about 1.742 million kilometers ( 1.083 million miles ) from Titan
and at a Sun-Titan-spacecraft, or phase, angle of 50 degrees. Image source: NASA, JPL |
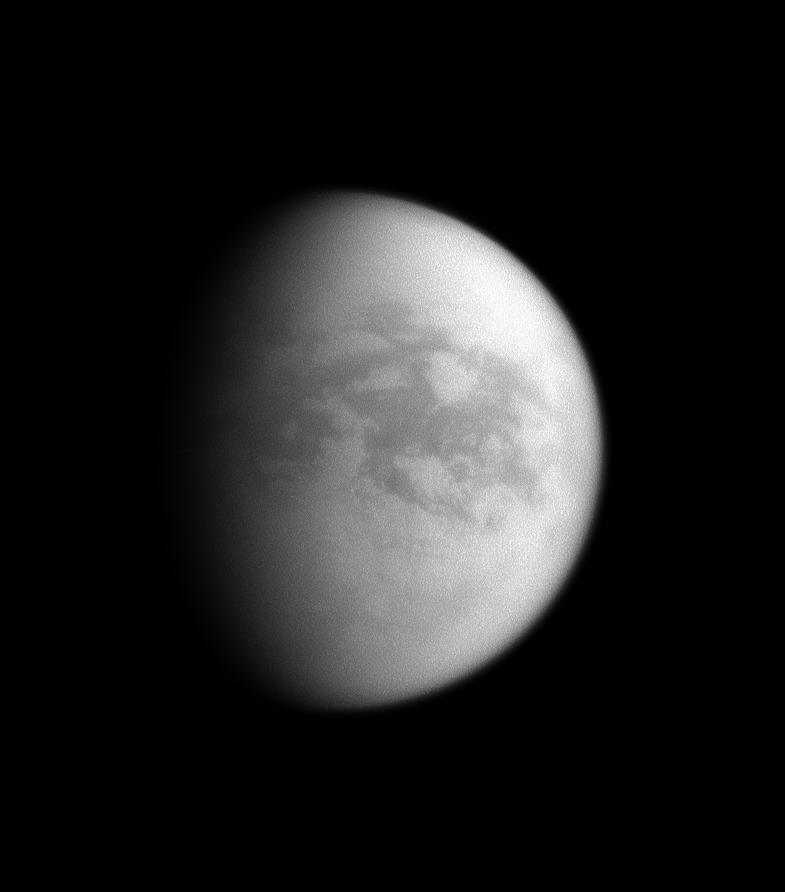 |
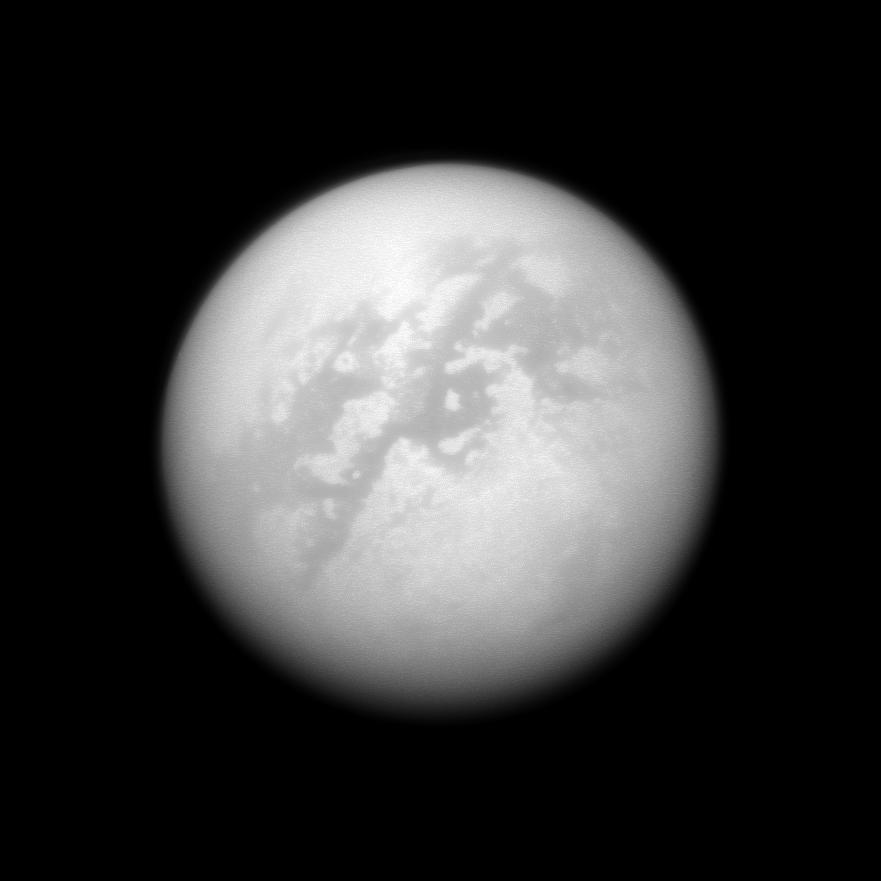
This infrared view of Titan,
centered on the Saturn-facing hemisphere, illuminates mainly the
trailing hemisphere
that is the hemisphere opposite to Saturn. The view was obtained
with the Cassini probe narrow-angle camera on November 9, 2008 using
a spectral
filter sensitive to wavelengths of infrared light centered at 938
nanometers. The image was acquired at a distance of about 1.774 million
kilometers
or 1.102 million miles from Titan and at a Sun-Titan-spacecraft,
or phase, angle of 56 degrees. Image source: NASA, JPL |
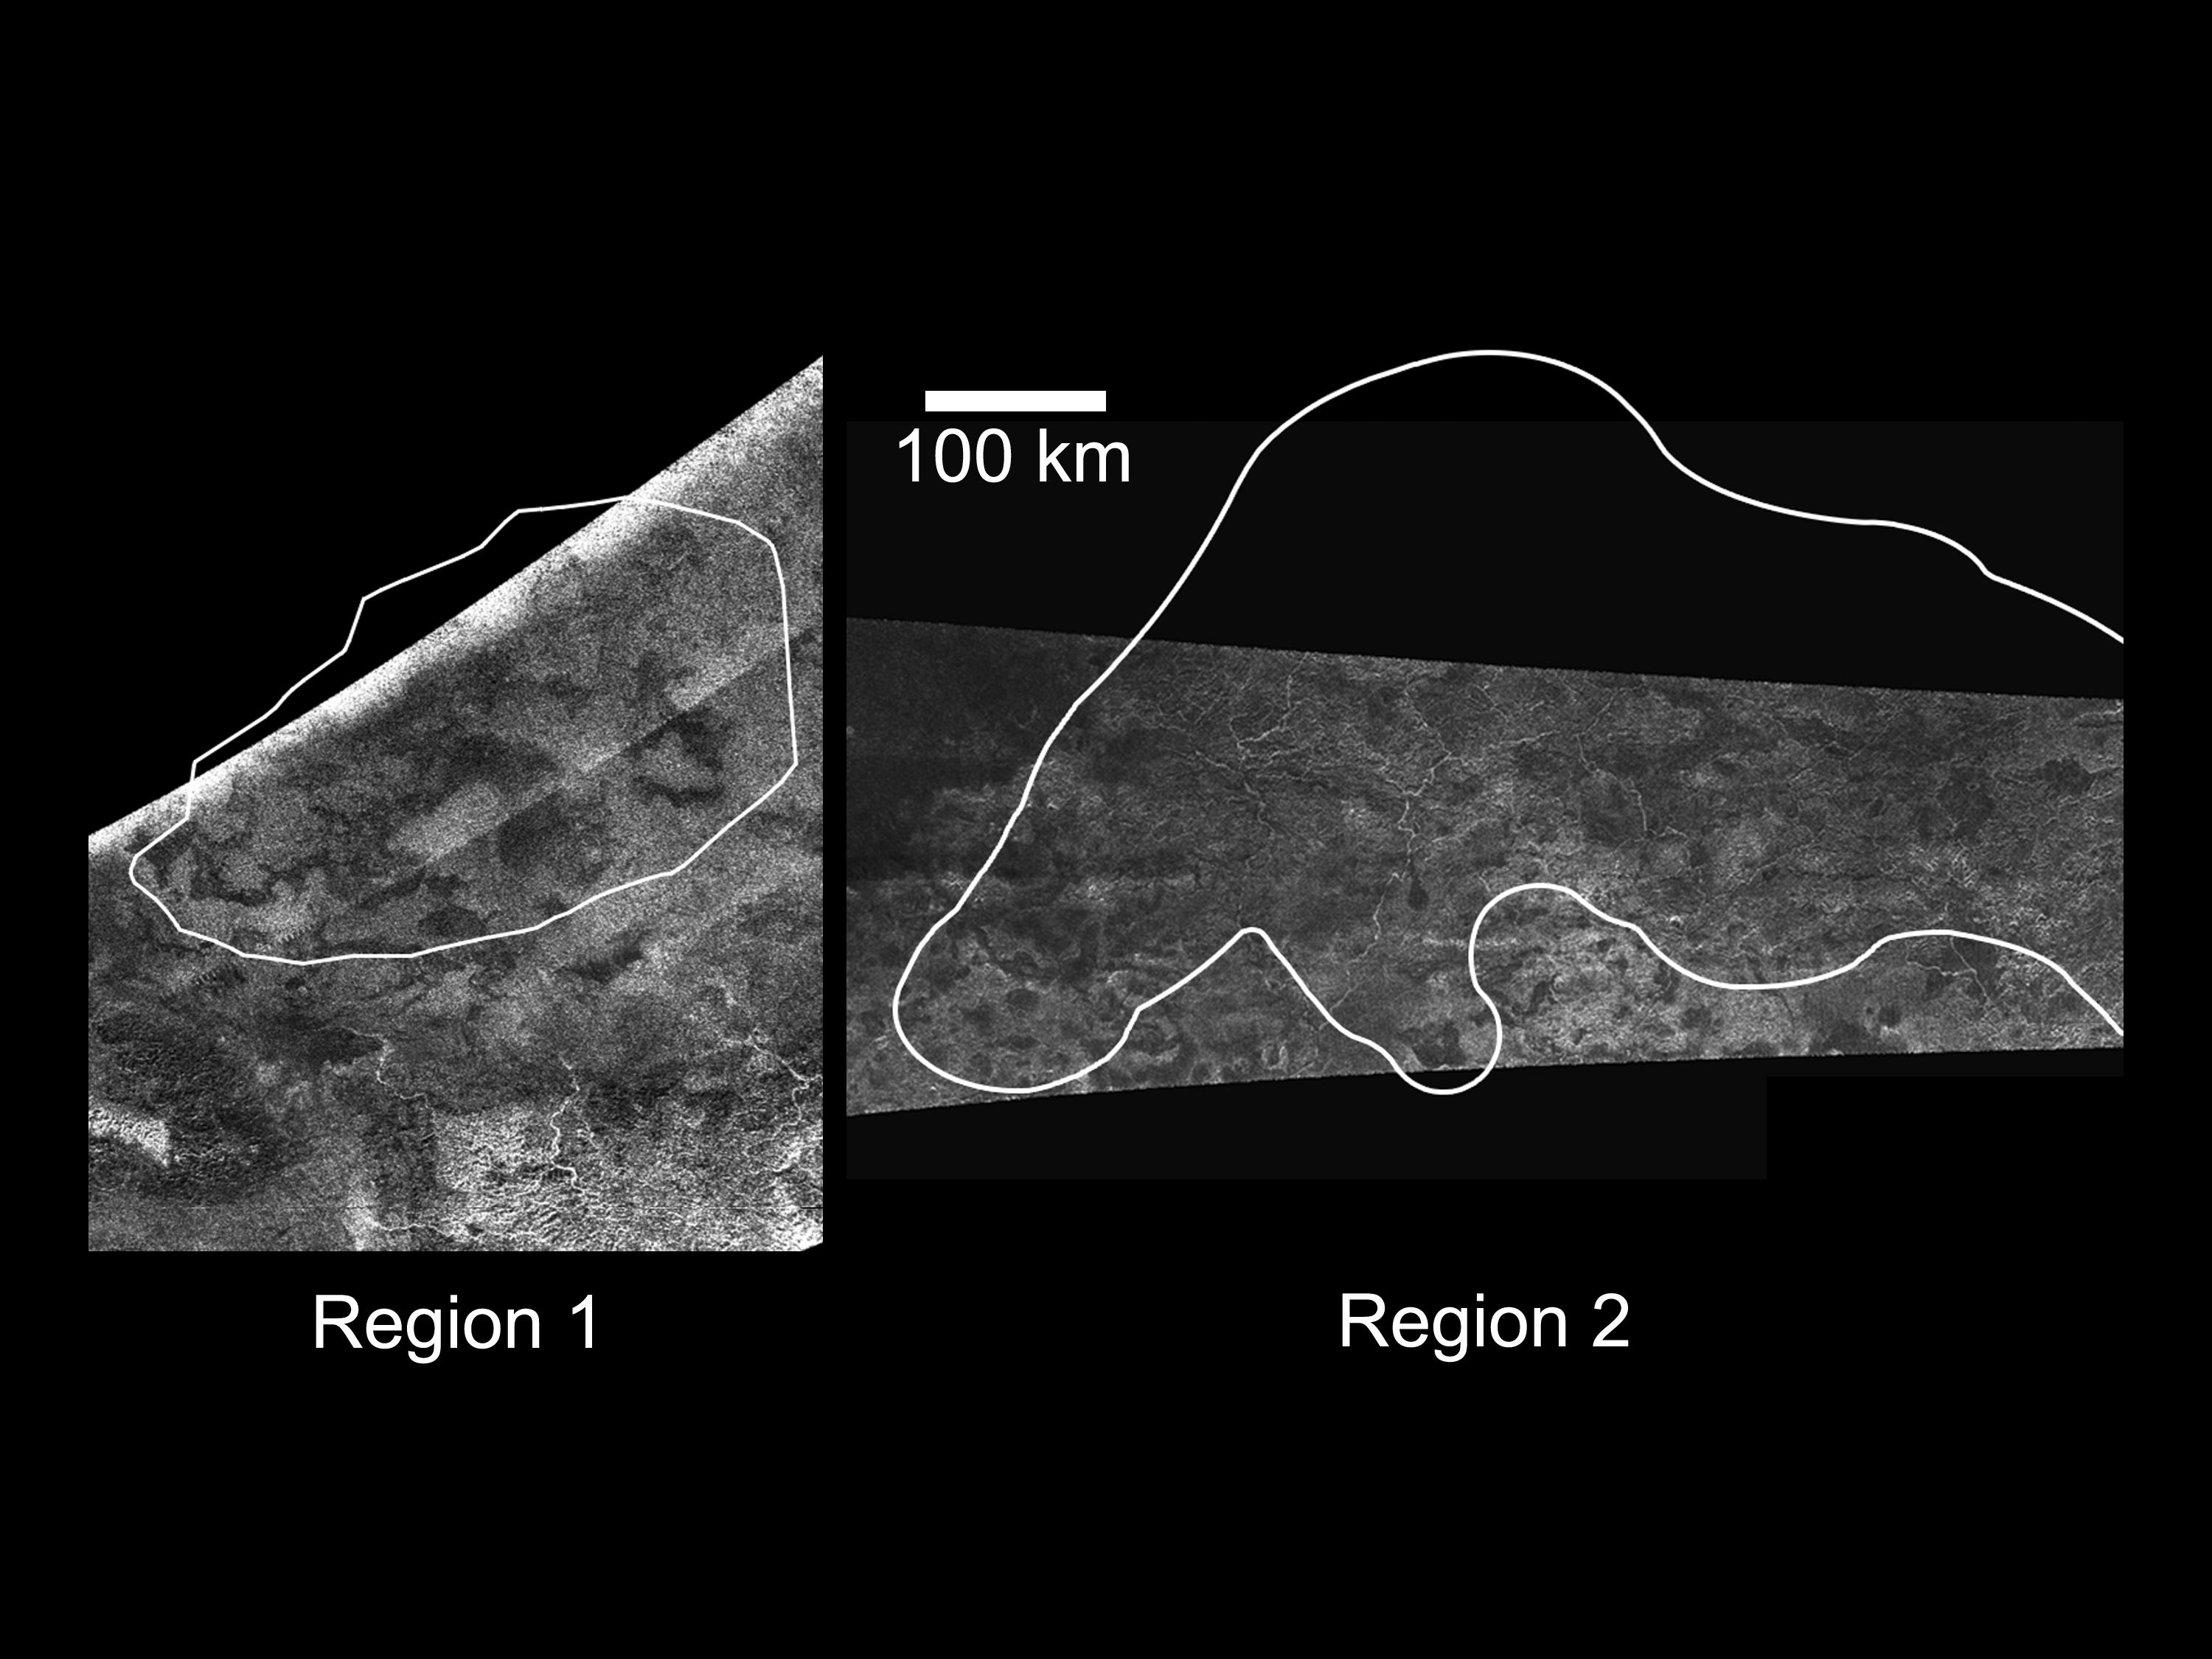 |
This set of radar images shows potential
active cryovolcanic areas on Titan on the basis of brightness variations
in VIMS images of the same locations. The left radar view was obtained
on February 22, 2008 by the Cassini Radar Mapper and the radar image
on the right was captured on April 30, 2006. Both radar images show
regions which are situated in the bright Xanadu area. Region 1, surrounded
by the white line, lies in the eastern part of Xanadu, just north of
the feature named Hotei Arcus and is centered on 28 degrees south latitude
by 78 degrees west longitude. The region is roughly 400 kilometers
or 249 miles across. Region 2, also surrounded by a white line, is
located on the western part of Xanadu and is centered on 7 degrees
south latitude
by 135 degrees
west
longitude. This area is roughly 900 kilometers or 560 miles across.
In both radar images, north is up, and landscape characteristics
as small as 300-500 meters can be resolved. Image source: NASA, JPL |
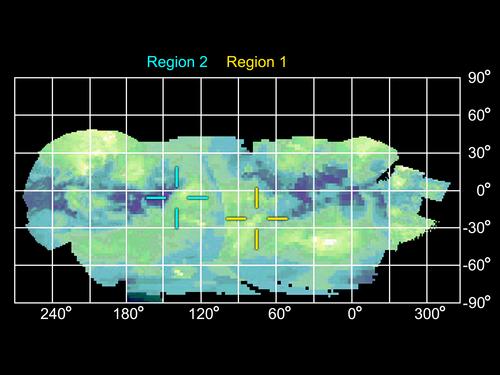 |
This infrared projection map
of Saturn's largest moon Titan was built on the basis of images obtained
by the Visual and Infrared Mapping Spectrometer from the Cassini
probe.
It especially reveals two regions that changed in brightness, identified
by a blue and yellow marking. The global view is an overlay of all
the high-resolution images from the first 45 flybys, up through last
February 2007 and the map was generated using the 2.1 micron wavelength.
The image scale is roughly 25 kilometers ( 16 miles ) per pixel or
1.8 pixels per degree. Image source: NASA, JPL |
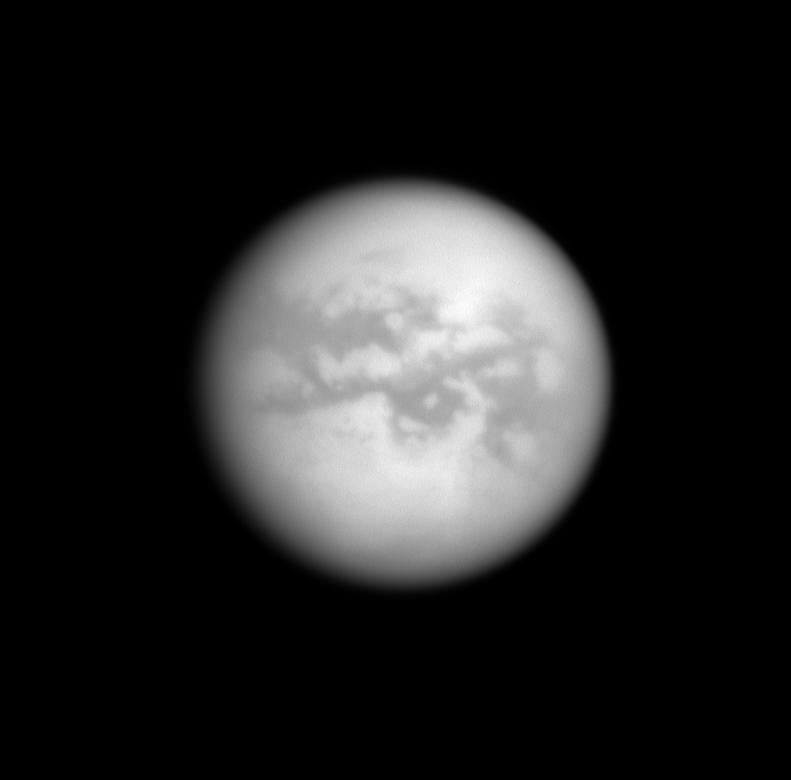 |
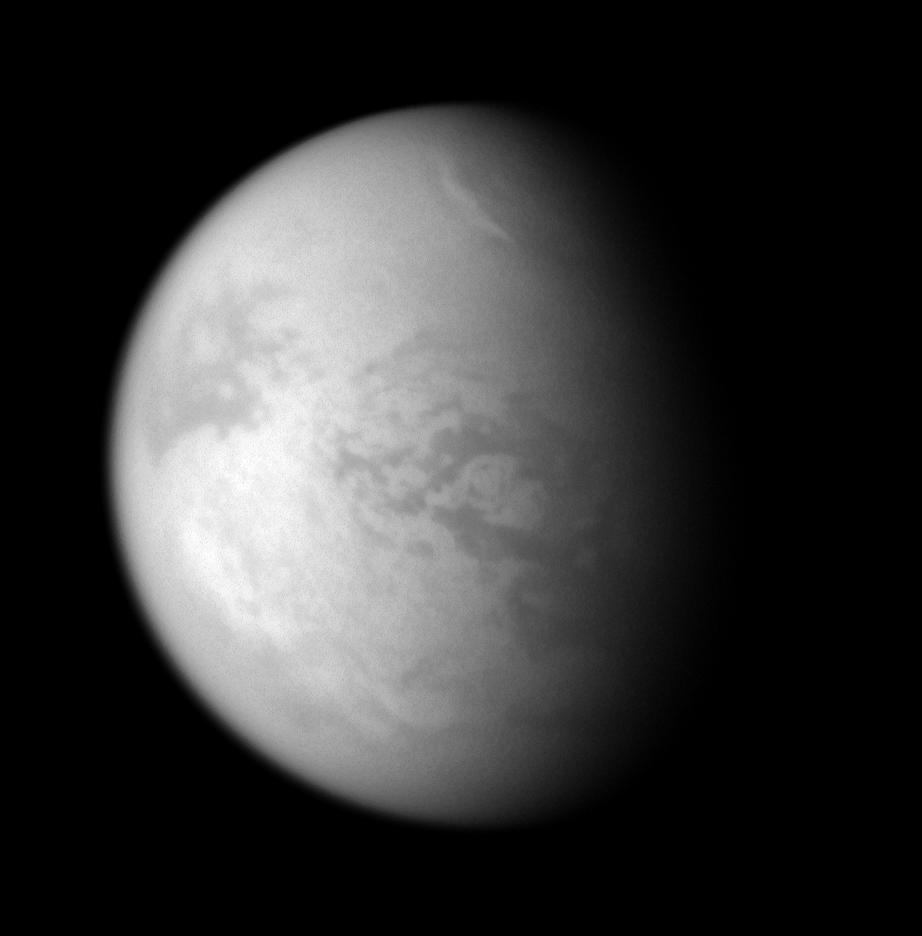
This infrared image of Titan which
unveils the orange moon on its Saturn-facing hemisphere was captured
with the Cassini probe narrow-angle camera on October 11, 2008 using
a spectral filter sensitive to wavelengths of infrared light centered
at 938 nanometers. North is up. The view was acquired at a distance
of about 2.222 million kilometers or 1.381 million miles from Titan
and at a Sun-Titan-spacecraft, or phase, angle of 10 degrees. Image source: NASA, JPL |
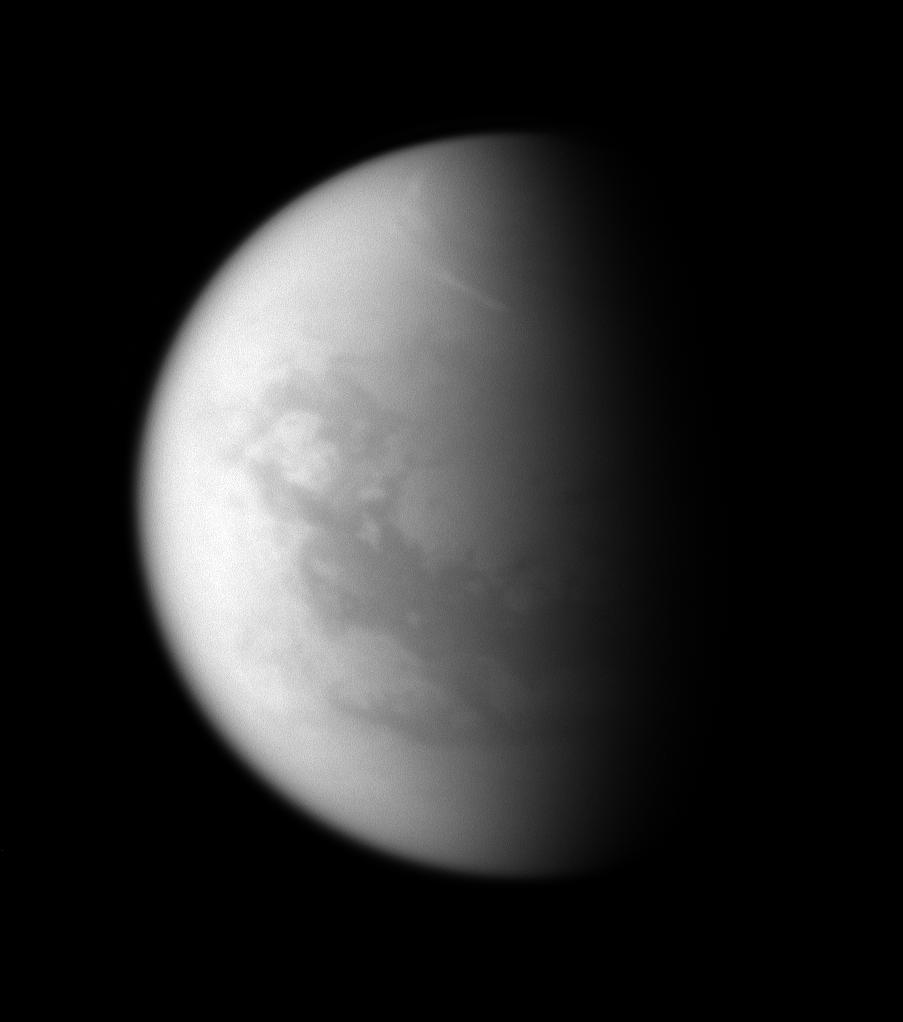 |
This infrared view of Titan was
obtained with the Cassini probe narrow-angle camera on September 30,
2008 using a spectral filter sensitive to wavelengths of infrared light
centered at 938 nanometers. The image was acquired at a distance of
about 1.2 million kilometers or 776,000 miles from Titan and at a Sun-Titan-spacecraft,
or phase, angle of 71 degrees. The north of Titan is up and rotated
16 degrees to the right. Image source: NASA, JPL |
 |
This infrared view of Titan was
obtained with the Cassini spacecraft narrow-angle camera on September
25, 2008 using a spectral filter sensitive to wavelengths of infrared
light centered at 938 nanometers. The image was captured at a distance
of about 1.7 million kilometers or approximately 1 million miles
from Titan. The image is centered toward the Saturn-facing hemisphere
of the moon and north is up and rotated 35 degrees to the left. Image source: NASA, JPL |
 |
The natural color image above which
combines views taken using red, green and blue spectral filters was
obtained with the Cassini probe wide-angle camera on October 26, 2007
at a distance of about 2.7 million kilometers ( 1.7 million miles )
from Titan and 1.5 million kilometers ( 920,000 miles ) from Saturn.
The spacecraft looks toward the unilluminated side of the rings from
less than a degree above the ringplane. Image source: NASA, JPL |
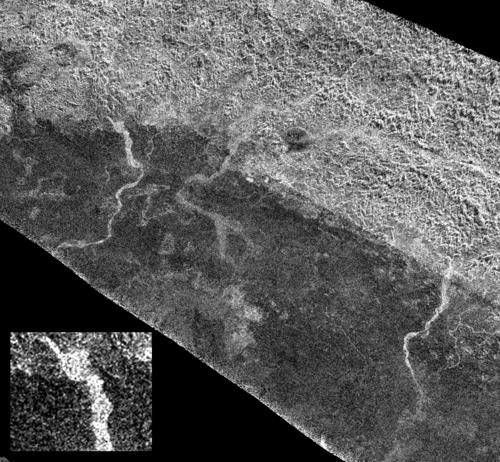 |
This set of radar images was obtained
by the radar mapper onboard the Cassini probe during the final Titan
flyby of the original four-year tour on May 28, 2008. The view in the
lower left of the mosaic is a targeted zoom of the upper image. The
radar instrument unveils the border of the region Xanadu as the bright-dark
boundary running from the upper left to lower right. This area is located
at 15 degrees south latitude and 121 degrees west longitude and it
is roughly 450 kilometers ( 280 miles ) across. North is up. Image source: NASA, JPL |
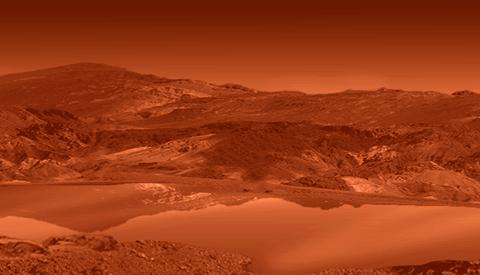 |
This artist impression proposed
by NASA and JPL is supposed to represent one of the Titan lakes containing
liquid hydrocarbons including ethane which has been positively identified
in Ontario Lacus, the giant kidney-shape lake situated in the south
polar region of the Saturn moon. Ethane has been clearly detected thanks
to the analysis of the infrared views of Ontario Lacus. The hydrocarbon
compound is probably mixed with nitrogen and other light hydrocarbons
like methane or acetylene. Image source: NASA, JPL |
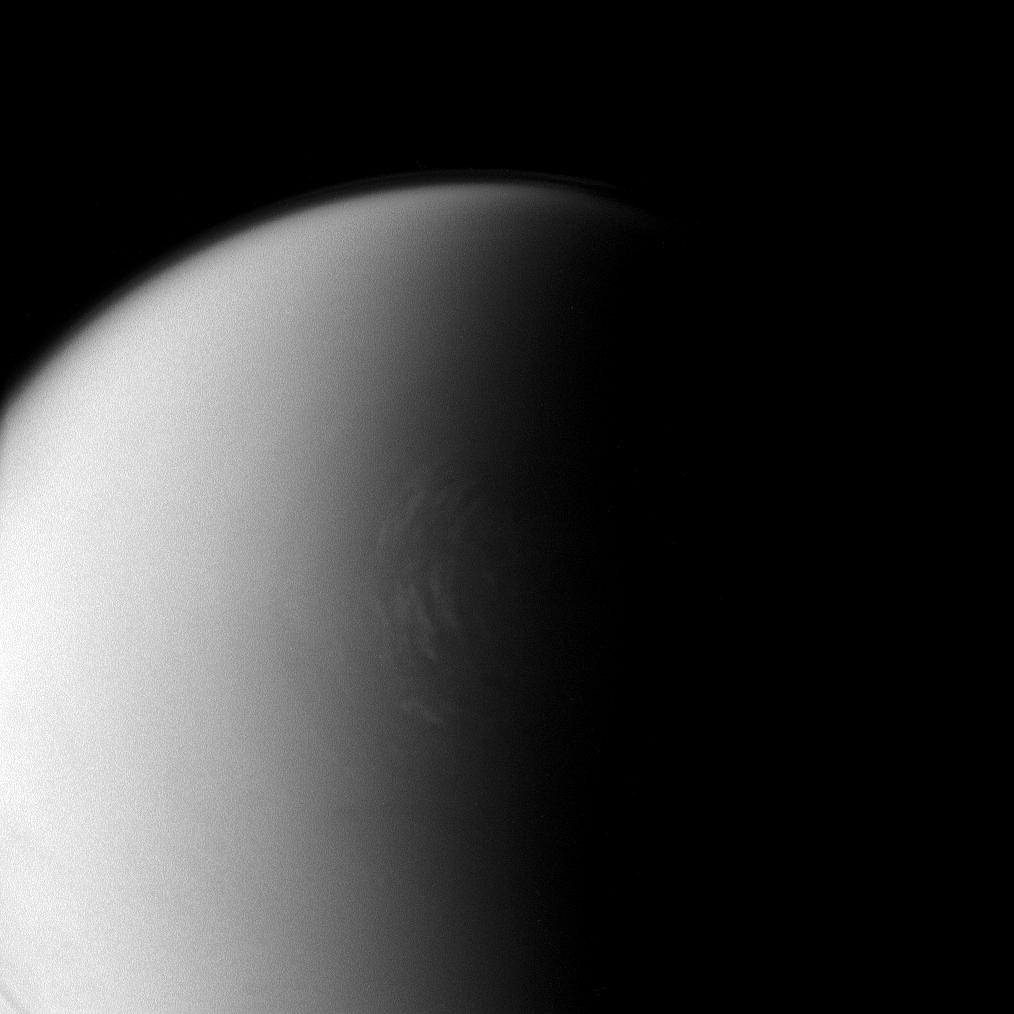 |
This infrared image was captured
with the Cassini probe narrow-angle camera ( Image Science Subsystem
) on April 26, 2008 using a spectral filter sensitive to wavelengths
of infrared light centered at 938 nanometers. The view focuses on
Titan's north polar region. The image unveils striking atmospheric
features:
bright clouds are encircling the north polar region. Some high-altitude
ethane clouds engulfing the north pole had already been identified:
the cloud formation had a spiral shape similar to a giant hurricane.
This time, parallel cloud bands or strips also seem to move along
a circular path around the north polar region. Image source: NASA, JPL |
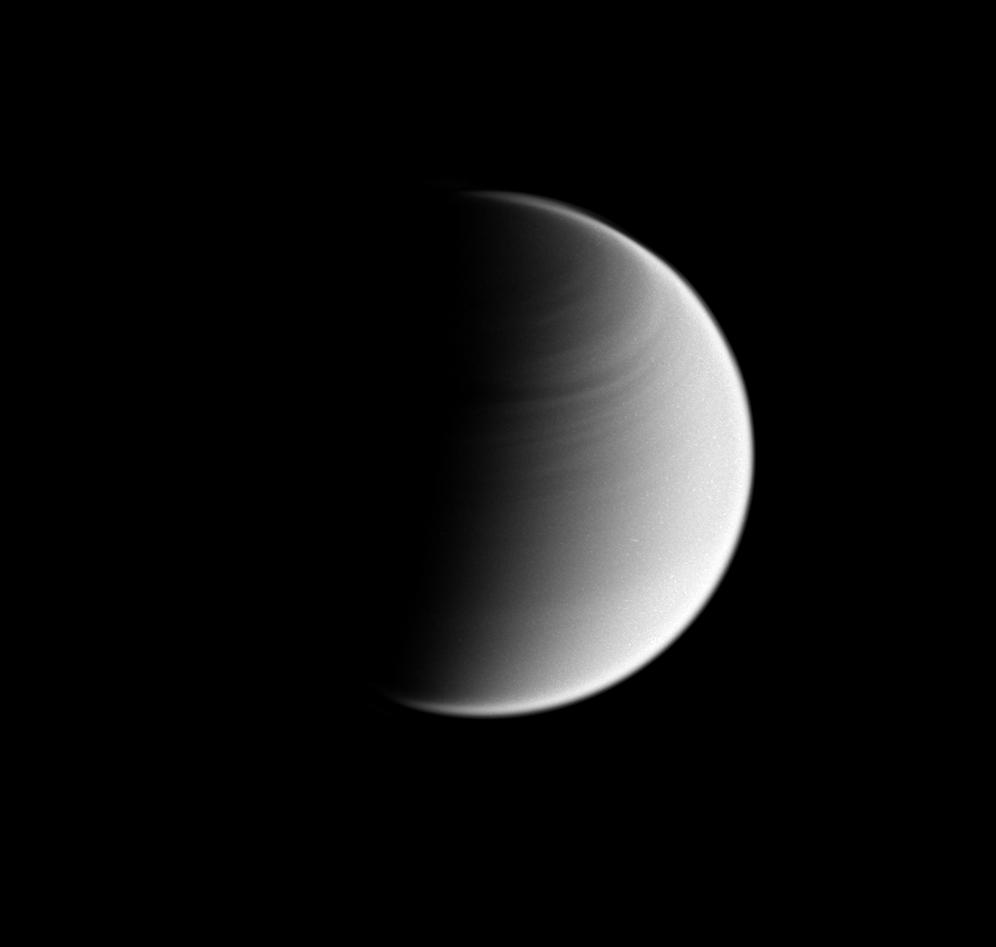 |
This global view of Titan was obtained with the Cassini spacecraft wide-angle camera in visible blue light on May 28, 2008. The image was captured at a phase angle or Sun-Titan-spacecraft angle of 89 degrees. The north of the Saturnian moon is up in this view. Titan's atmosphere is very complex, deep, thick, dense and opaque in visible light. This view unveils banding in the atmosphere of the northern hemisphere, atmospheric bands which appear parallel to the equator, similar to what is observed on gas giants like Jupiter or Saturn. Titan's atmosphere presents some similarities with Venus' atmosphere: both atmospheres undergo the phenomenon of "super rotation". In other words, the atmospheres of those two worlds rotate faster than the surface revealing a sharp disconnection between the movement of the gas blanket and that of the crust or the surface. Image source: NASA, JPL |
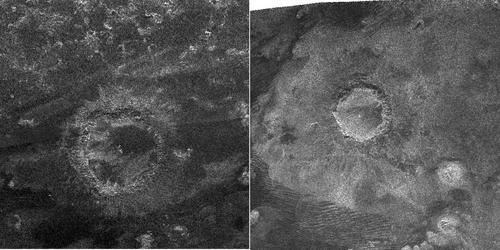 |
This set of radar images which
were obtained in different places of Titan's surface enables us to
compare
two circular features definitely identified as impact craters. Both
views are around 350 kilometers wide ( 217 miles ). The crater on
the right, Sinlap, first spotted in 2005, is approximately 80 kilometers
( 50
miles )
in diameter
and
is
estimated
to be about
1,300 meters deep ( 984 feet ). One can note that the radar illumination
comes from above and that the crater appears dark
and bright in its surrounding in infrared images. Therefore, the
meteor must have hit a bright area. Image source: NASA, JPL |
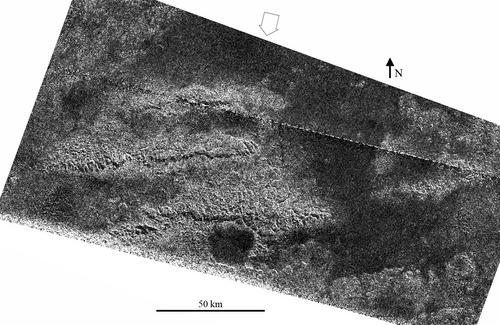 |
This radar portion was captured
by the Cassini spacecraft's radar instrument during the Titan flyby
on May 12, 2008. The view is centered at 2 degrees south latitude,
127 degrees west longitude in the mountainous region named Xanadu.
The white arrow
shows
the direction of radar illumination. Three parallel ridges as well
as a
circular
feature
are
clearly visible
in
the image. One can notice some similarities between those ridges and
mountain chains identified during a flyby in October 2005 at similar
latitudes but roughly 90 degrees to the west, just west of Shangri-La.
In both regions, mountain chains or ridges follow the same direction,
that is west-to-east and are spaced around 50 kilometers ( 30 miles
) apart. Image source: NASA, JPL |
|
|
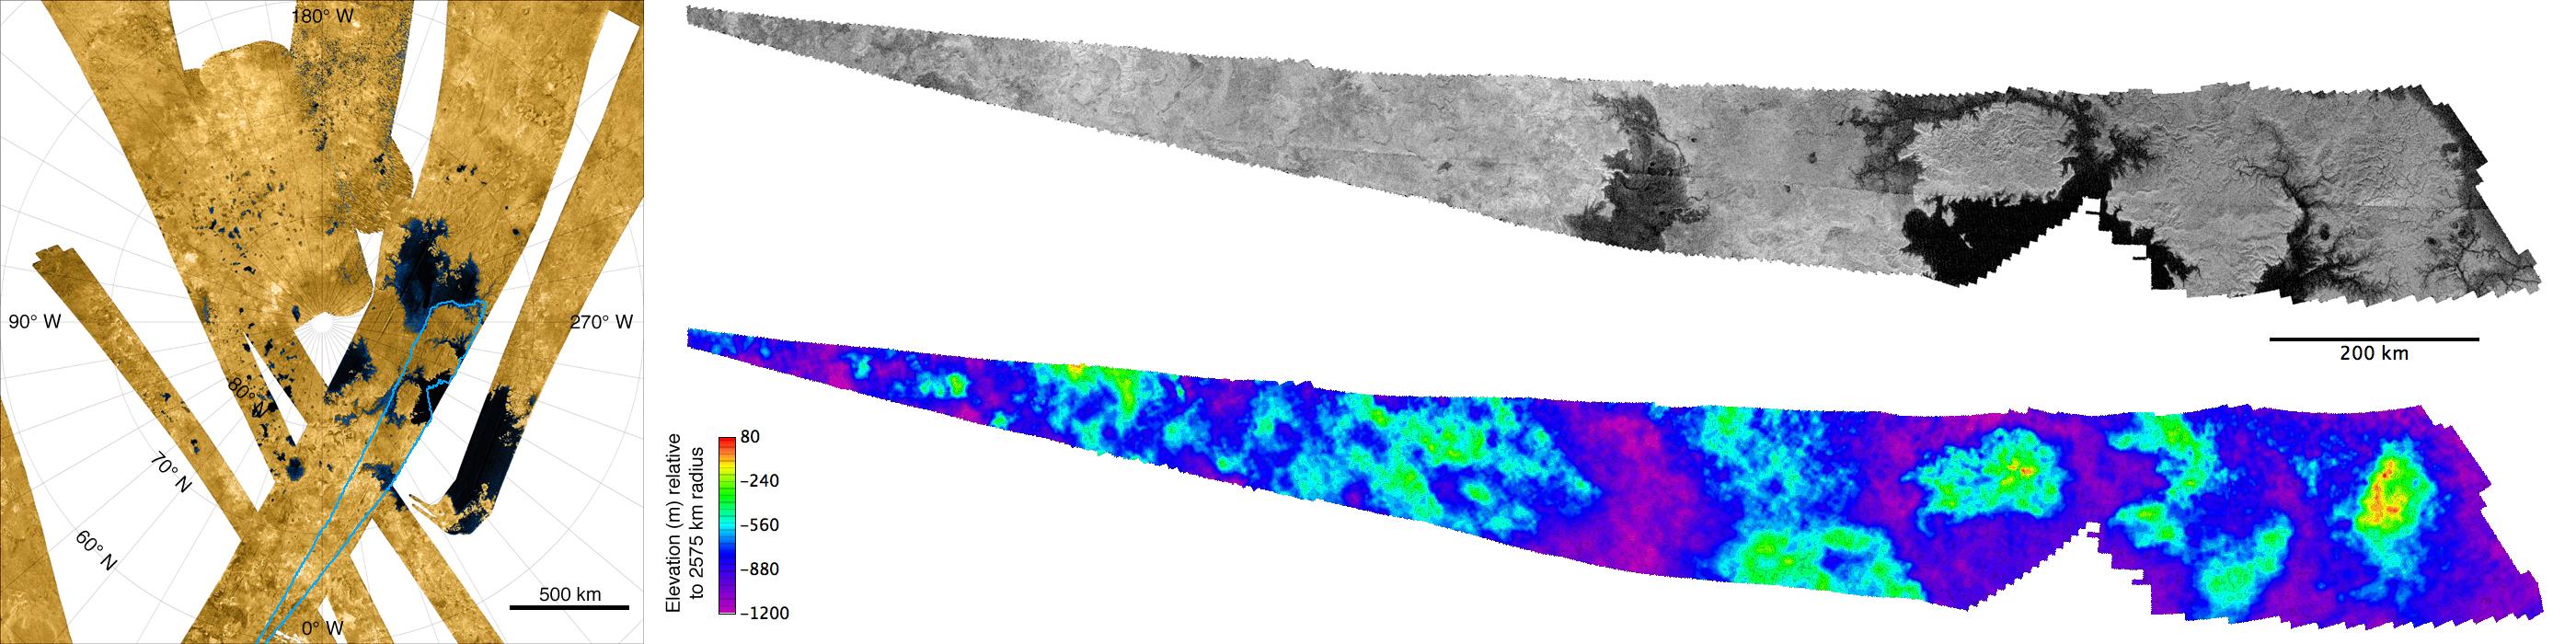
This combination of maps reveals,
notably, topographic features in Titan's north polar region. The
image on the left corresponds to a mosaic of combined radar images
captured by the
Cassini spacecraft during several flybys. The colors have been artificially
added to emphasize the contrast between radar-dark areas
believed to be bodies of liquid ( shown in blue and dark ) and the
relatively radar-bright dry land areas appearing in shades of brown.
The darker the radar scan of the pool, the deeper it is expected
to be. The brighter the radar scan of the terrain, the drier it is
supposed
to be. A brighter spot or line in the radar map can also be interpreted
as a mountain, a hill or an elevated terrain. The topographic features
of what appear to be lakes or seas clearly start to appear above
60 degrees north latitude as the false color mosaic shows. The liquid
areas are most likely made up of methane, ethane and dissolved nitrogen. Image source: NASA, JPL |
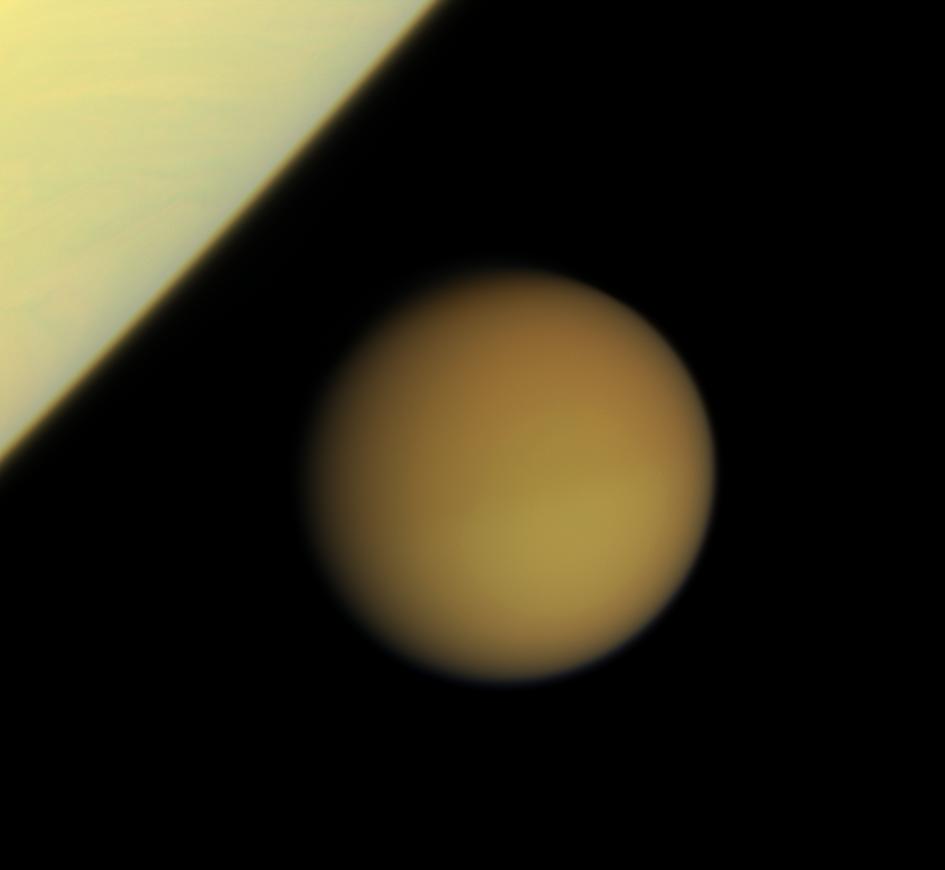 |
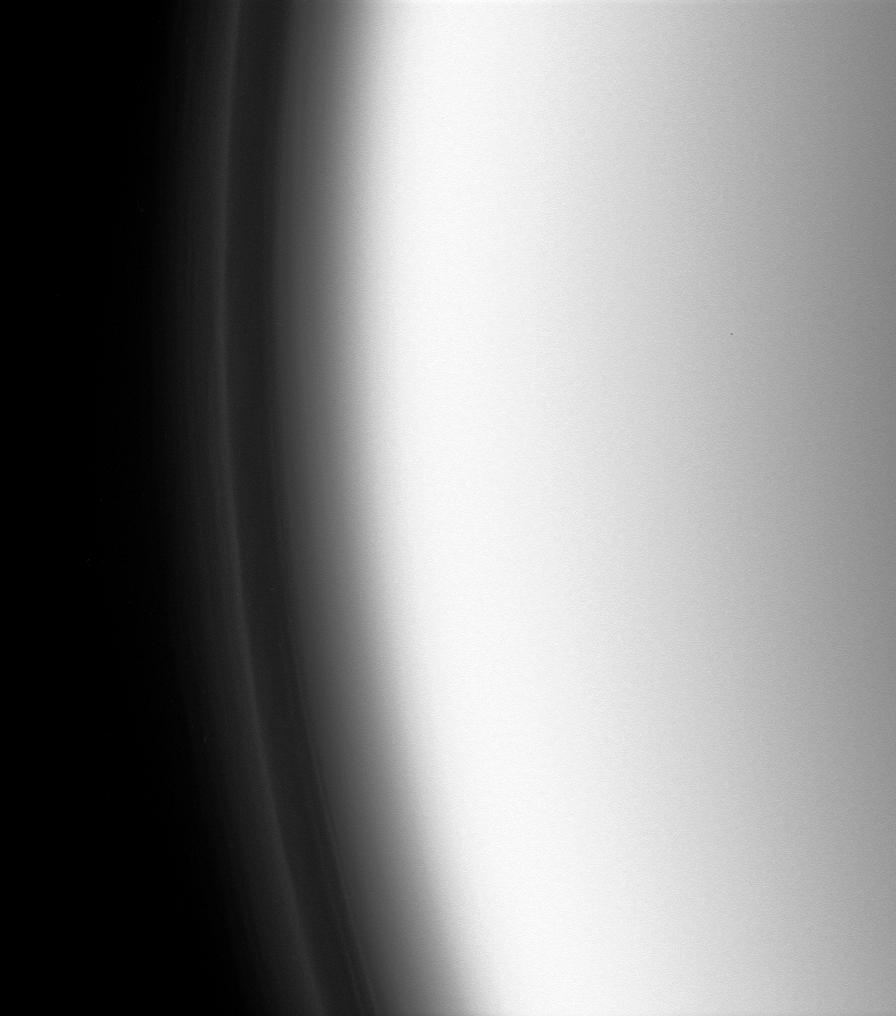
This natural color view of Titan,
approaching the brilliant limb of Saturn, was obtained on January
29, 2008 with the Cassini probe narrow-angle camera, at a distance
of about
2.3 million kilometers from Titan ( 1.4 million miles ). It combines
images taken using red, green and blue spectral filters. The images
were captured just minutes after a wide-angle image showing the tiny
moon of Titan near the giant ring planet. Although their appearance
presents some similarities such as an opaque and uniform ( or almost
uniform
) atmosphere, their internal nature is very different: Saturn is
a gas giant while Titan is an icy moon. The atmosphere of Titan is
dominated
by molecular nitrogen and methane while Saturn's atmosphere is mainly
composed of hydrogen and helium with minor gases such as methane
and ammonia. Image source: NASA, JPL |
 |
This infrared view of the biggest
Saturn moon was captured with the Cassini spacecraft narrow-angle camera
on January 20, 2008 using a combination of spectral filters sensitive
to wavelengths of polarized infrared light centered at 938 and 746
nanometers. The image was obtained at a Sun-Titan-spacecraft, or phase,
angle of 58 degrees. North, here, is up and rotated 26 degrees
to the right. Image source: NASA, JPL |
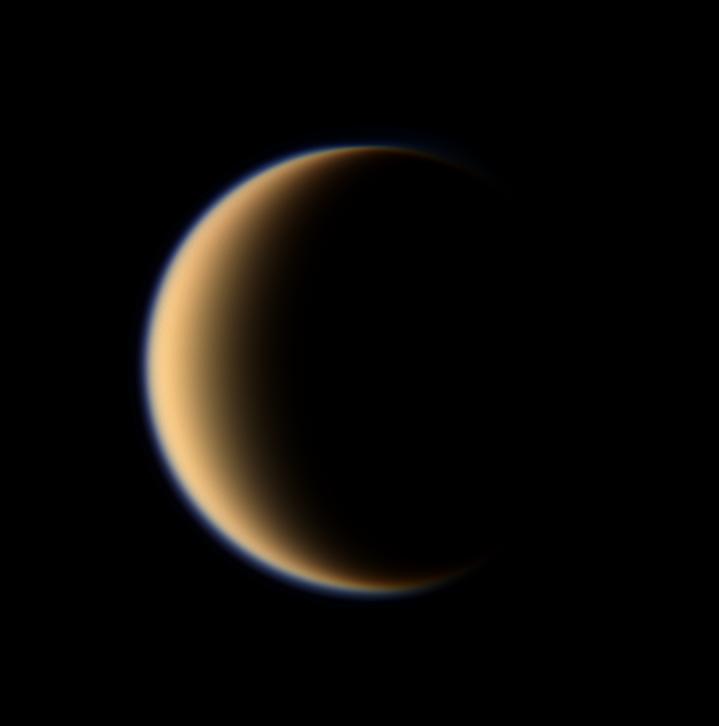 |
This natural color view of Titan, partly illuminated, was captured with the Cassini spacecraft wide-angle camera on January 5, 2008. It combines images using red, green and blue spectral filters and it was obtained at a Sun-Titan-spacecraft, or phase, angle of 128 degrees. North on this Saturn-moon view is up and rotated 30 degrees to the right, tilting slightly away from the spacecraft. The thick and dense atmospheric layer makes the Saturn moon completely opaque in the visible spectrum. The orange haze is made of complex organic molecules. In the upper atmosphere, methane molecules are being broken apart by solar ultraviolet light and the resulting molecules combine or recombine to form compounds like ethane, acetylene or hydrogen cyanide.The blue color in the upper atmosphere is the outcome of that photolysis: the haze preferentially scatters blue and ultraviolet wavelengths of light. Image source: NASA, JPL |
 |
This ultraviolet view of Titan was captured with the Cassini spacecraft narrow-angle camera during a recent flyby on December 20, 2007 using a spectral filter sensitive to wavelengths of ultraviolet light centered at 338 nanometers. The image was obtained at a Sun-Titan-spacecraft, or phase, angle of 133 degrees. The atmospheric layers can be well distinguished in the ultraviolet spectrum. Titan's atmosphere appears very complex with multiple haze layers. The gas blanket is well deeper and more massive than the Earth's atmosphere. Some complex organic molecules are being produced in Titan's atmosphere through the interactions with ultraviolet radiations. A detached, external haze layer is clearly visible in Titan's upper atmosphere in this image. Image source: NASA, JPL |
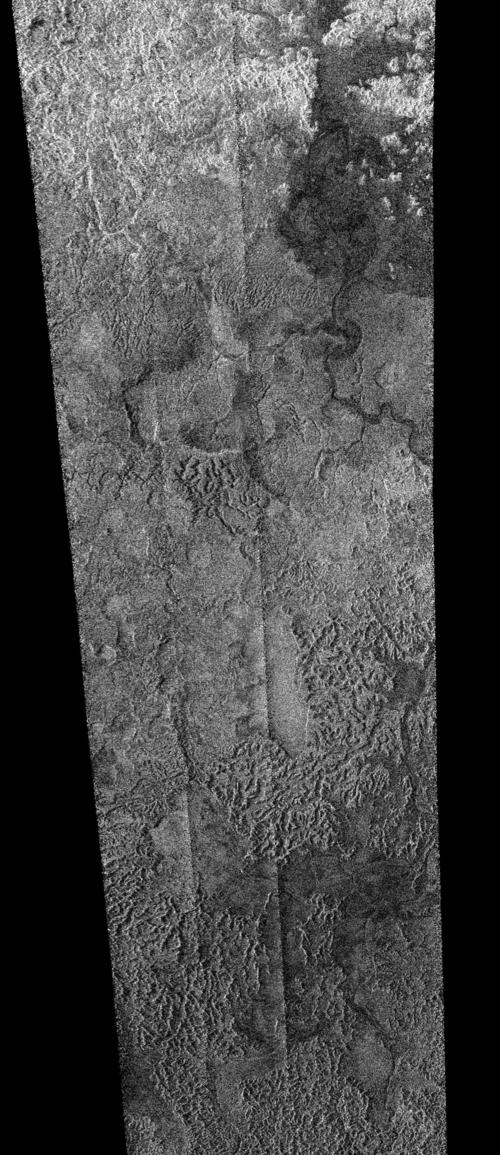 |
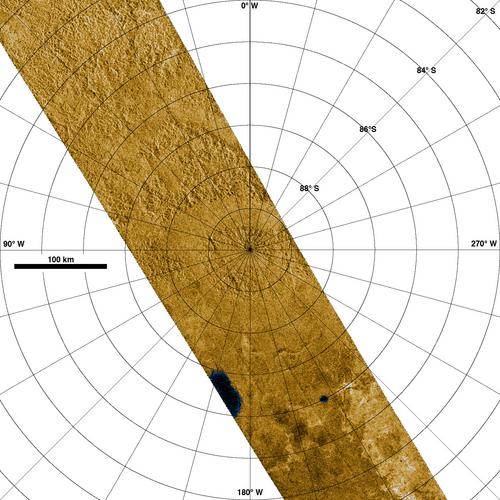
The synthetic aperture radar
image, above, was captured by the Cassini probe during its pass over
Titan's
south pole on December 20, 2007. The view is centered near 76.5 degrees
south, 32.5 degrees west and covers an area of 620 kilometers by
270 kilometers ( 385 miles by 170 miles ). Image source: NASA, JPL |