Titan Images 2016

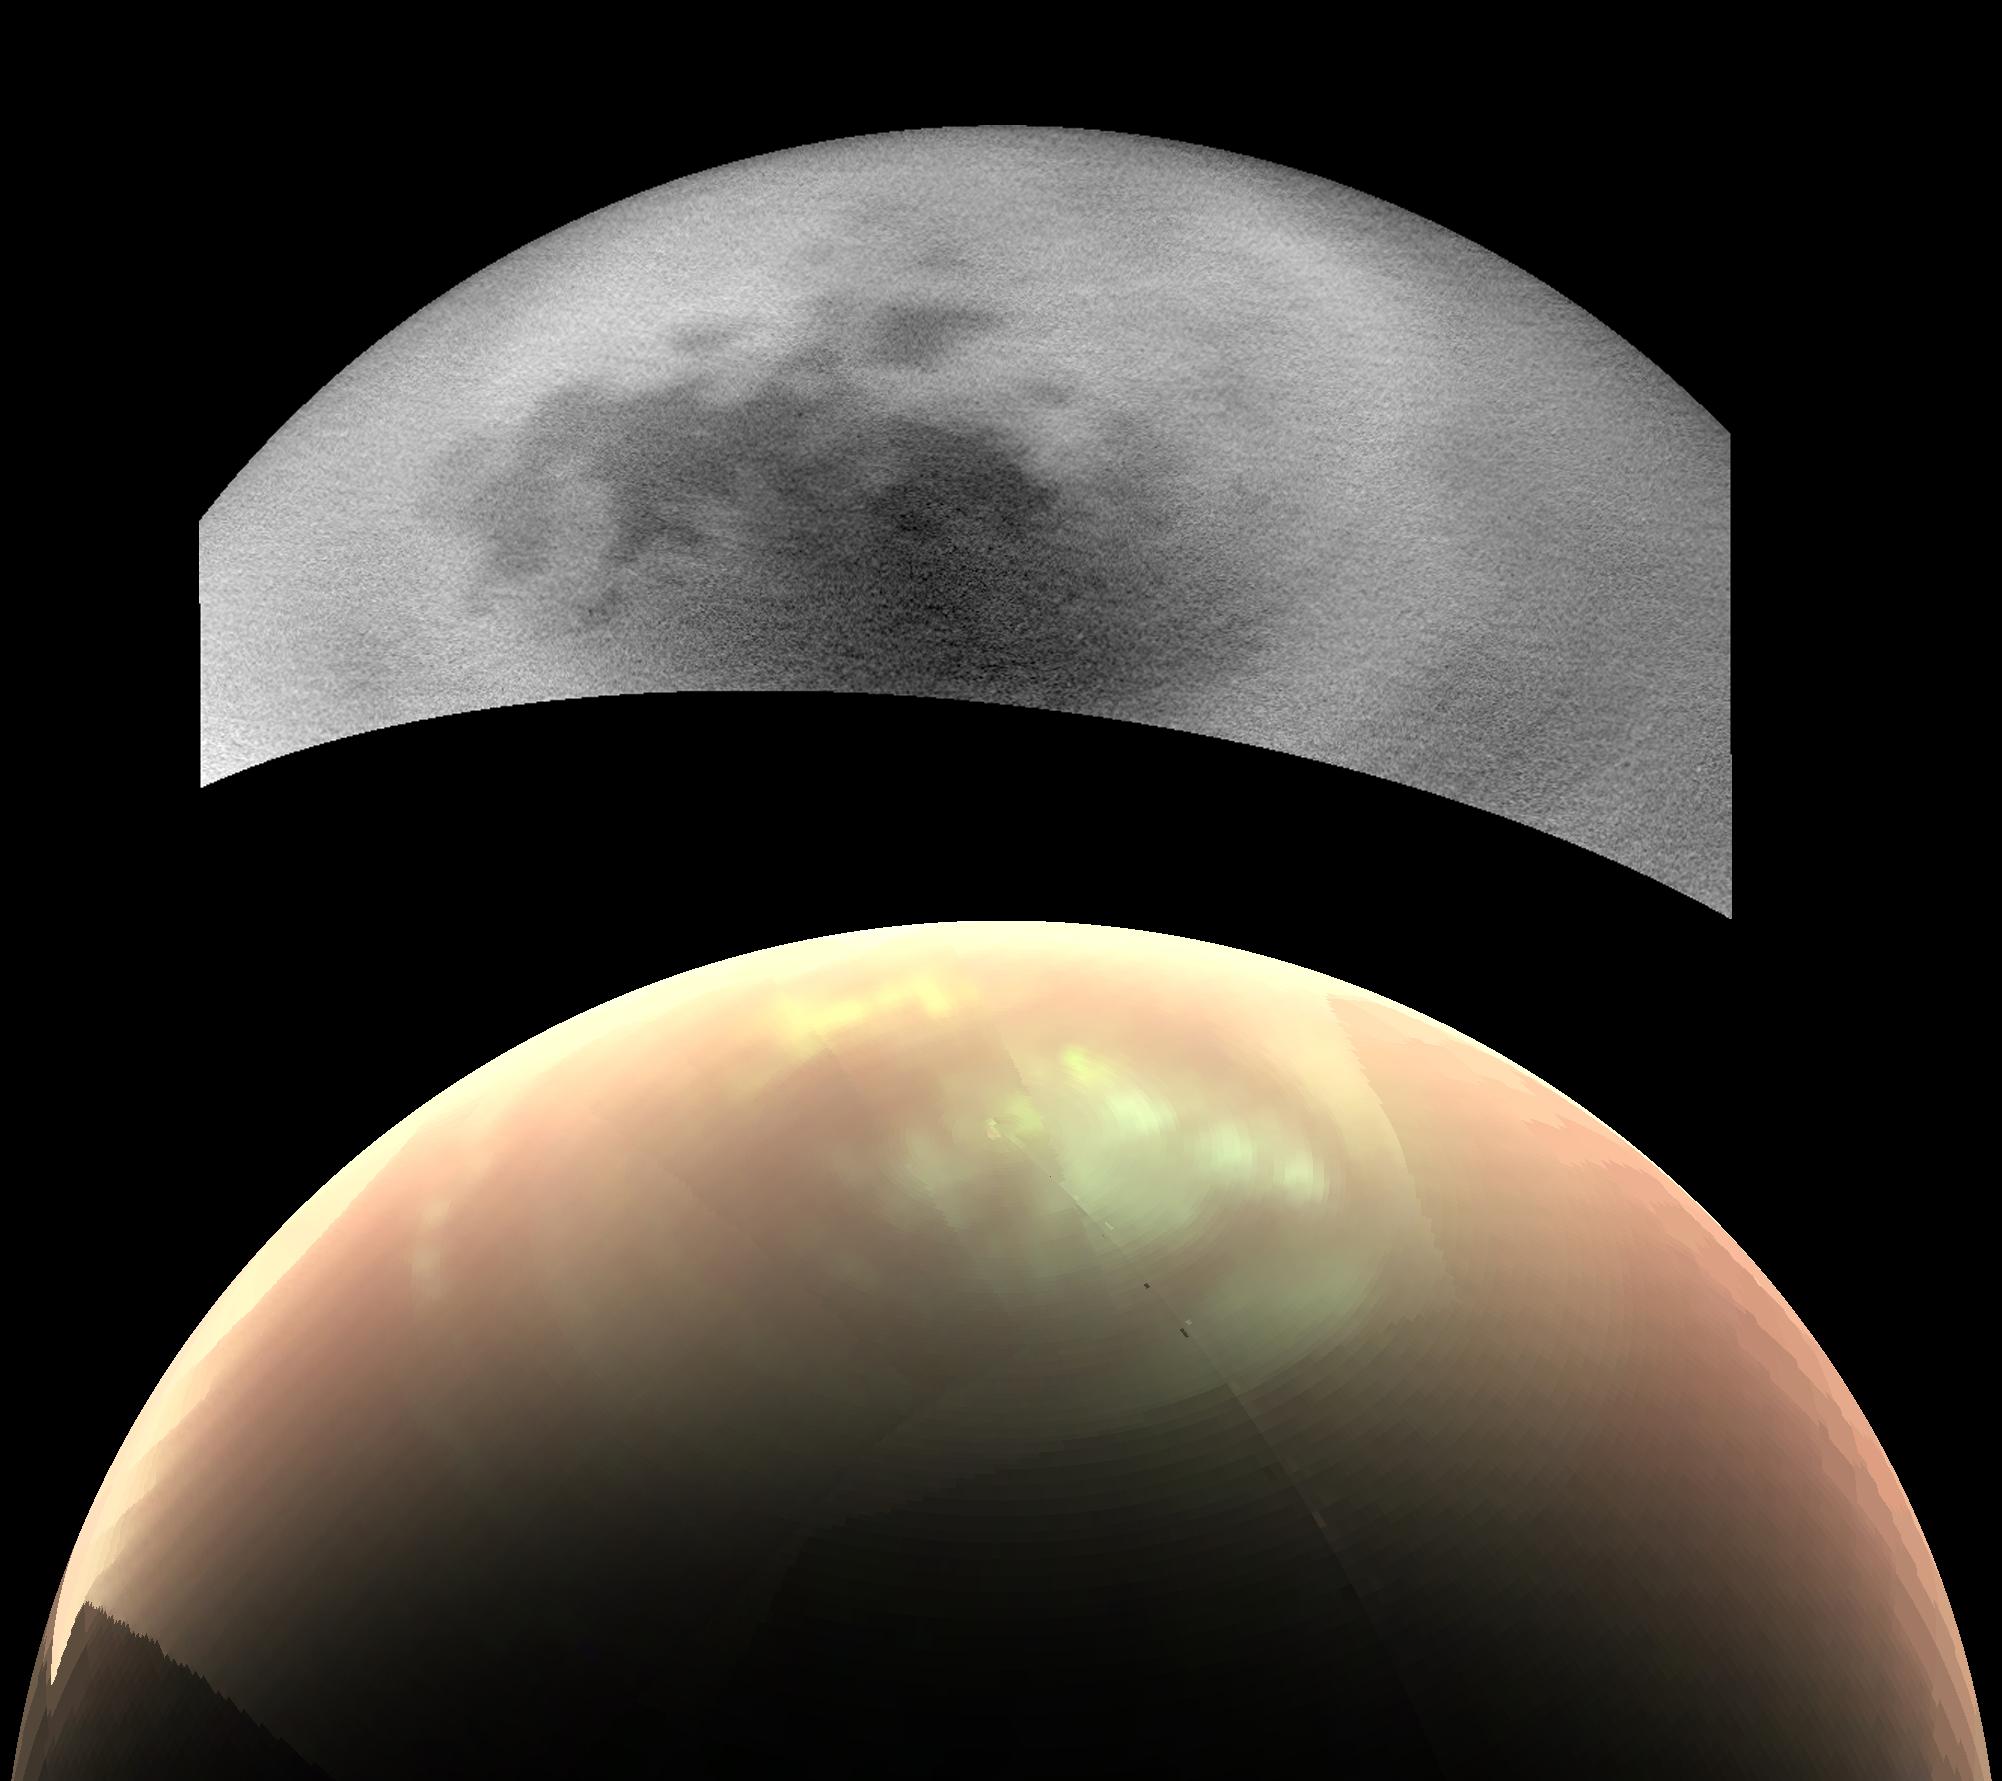
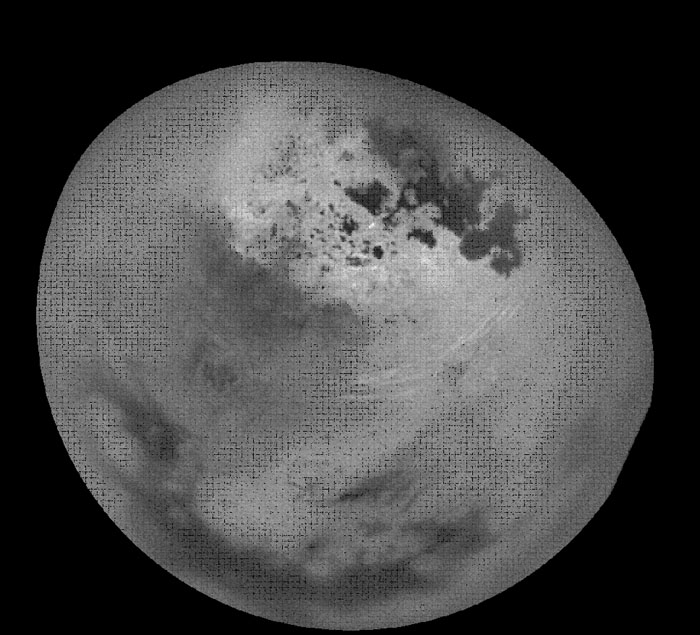
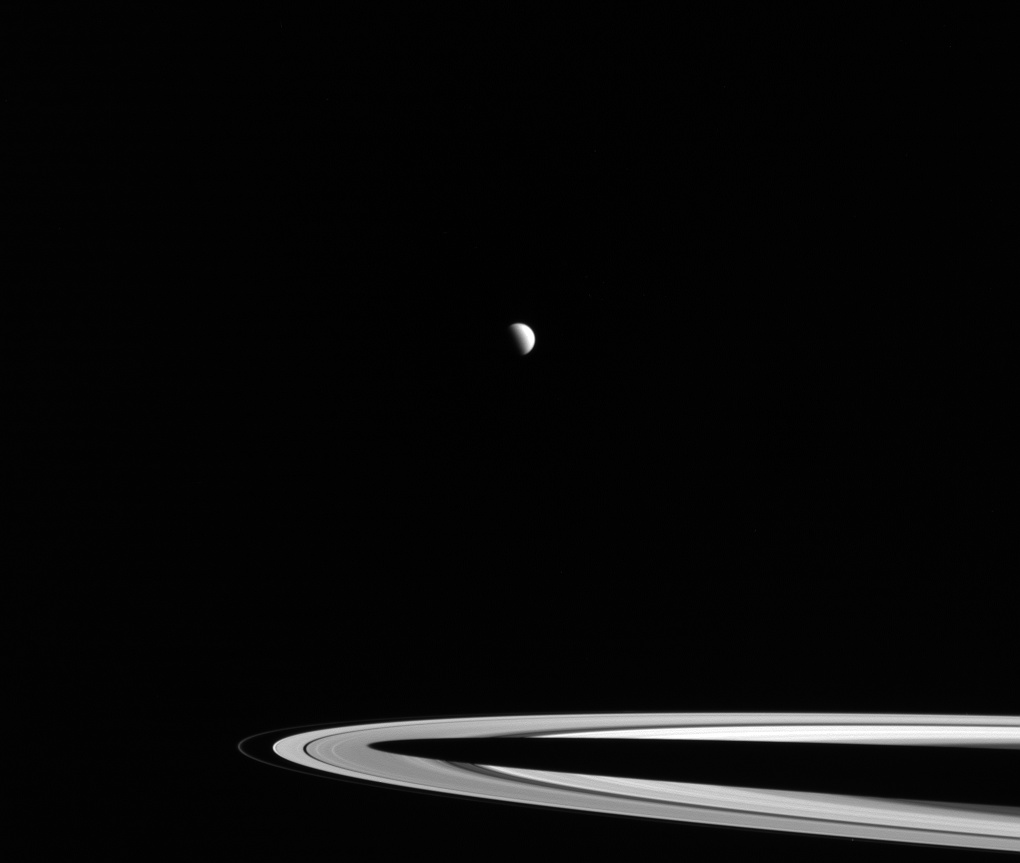
The mosaic above reveals two views of Titan's north polar region obtained during the T120 Flyby on June 7, 2016 with the Visual And Infrared Mapping Spectrometer (VIMS) and on June 8, 2016 with the Imaging Science Subsystem (ISS). The upper image of Titan in this mosaic represents an ISS view and the lower image of the Opaque Moon corresponds to a VIMS view. The Cassini probe was evolving at a distance of approximately 28,000 miles or 45,000 kilometers from Titan when the VIMS image was taken and at a distance of about 398,000 miles or 640,000 kilometers when the ISS view was acquired. The VIMS view has been processed in order to increase the visibility of the clouds. The colors are artificial. Clouds appear almost white whereas atmospheric haze appears pink and surface areas unveil a green color.
The clouds can be identified in certain wavelengths, in the near-infrared or infrared wavelengths. The upper view of Titan's northern hemisphere represents a near-infrared image captured from the imaging cameras of the Cassini spacecraft. The clouds appear hard to find. But they are easier to find in the lower view which was obtained at longer infrared wavelengths. A large field of bright clouds can be discerned. Researchers were quite surprised to notice the relative absence or the limited amount of clouds in the upper view. As a result, they have been trying to provide a clear answer to the remarkable difference between both images.
The seas or lakes in the upper view can be clearly seen whereas they appear hidden in the lower image. Researchers working on VIMS or ISS views were expecting to find more clouds in the high latitudes of the northern hemisphere as the Winter season approaches and develops in the area on the basis of their atmospheric models and on the basis of observations of the south polar region in 2004 at the end of the Summer season in the southern hemisphere. Dynamic cloud systems had been clearly observed in the high latitudes of the southern hemisphere in the area of the famous lake or sea Ontario Lacus. Scientists want to see, in the coming months, whether there will be an increasing amount of clouds in the high latitudes of the northern hemisphere where most lakes and seas are concentrated on Titan.
Scientists managed to obtain, via the Cassini probe, images of high northern latitudes over extended time periods exceeding 24 hours during the "T120" Flyby on June 7, 2016 and the "T121" Flyby on July 25, 2016 enabling the monitoring of the evolution of clouds in the area of lakes and seas. They have been in a position to notice remarkable differences in the way the clouds, the atmosphere or the landscape appear with the ISS and with the VIMS. In the ISS view shown in the upper part of the mosaic, the image is monochrome, surface features can be easily discerned and a limited amount of clouds which are small and isolated can be identified. On the other hand, in the VIMS view unveiling different colors, clouds seem everywhere or widespread in each flyby. The views were acquired in the same period implying that changes in illumination geometry or cloud movements can't account for this radical difference. The VIMS images unveil persistent atmospheric features during the whole observation campaign whereas ISS views unveil very few atmospheric features such as clouds.
The radical difference in the way the ISS views and the VIMS views appear may be closely related to the hazy atmosphere of the Orange Moon which is much easier to observe through at the longer infrared wavelengths than at the shorter, near-infrared wavelengths. The VIMS instrument is sensitive to longer infrared wavelengths than the ISS instrument. Thus, the VIMS instrument will study the atmosphere with a spectrum reaching up to 5 microns whereas the ISS instrument will study the soil, the topography, surface features, clouds or the lower atmosphere at lower wavelengths at 0.94 microns. At longer wavelengths, high and thin cirrus clouds can appear thicker or denser than the atmospheric haze. By contrast, however, they can appear thinner than the environmental haze at the shorter wavelength. That's why they can't be seen in the ISS view but they can be clearly noticed in the VIMS view. That's a paradox related to the opaque atmosphere of Titan where a complex chemistry involving organics, haze, fog or clouds occurs. A cloud is always harder to identify on a hazy day and the boundary between a fog blanket and a cloud is not always obvious. The atmospheric phenomenon has not been observed again since July 2016 but the Cassini probe will have new opportunities to observe Saturn's largest moon in the coming months until the end of the mission in 2017. Will there be significant changes in the dynamics and in the amount or concentration of clouds in the high latitudes of the northern hemisphere ? That's a major question that researchers want to answer.

Image Credit: NASA/JPL-Caltech/SSI/University of Arizona/University of Idaho.


The image above represents a frame of a time-lapse video generated on the basis of images obtained on January 14, 2005 from two imaging instruments of the Huygens probe during its atmospheric descent toward the surface of Saturn's largest moon Titan. The Huygens module which weighed 705 pounds or 320 kilograms collected, via its cameras, about 3,500 images. The views were transmitted to Earth  via the Cassini Orbiter which acted as a relay. The Huygens probe managed to land at a low latitude in the Adiri/Shangri-La region which reveals a contrast between bright hills unveiling fractures or drainage channels and a dark, brown or orange plain which may have been covered by liquid methane or liquid ethane in the past. The Huygens module operated for several hours from its atmospheric plunge and stayed within radio contact during the three-and-a-half-hour mission. The data board in this view indicates that the Huygens probe was evolving at an altitude of about 20 km when this panoramic view was produced. The atmosphere of Titan is composed of a relatively significant fraction of methane which can form clouds and fall as rain. The landing site revealed strongly eroded stones or pebbles implying that the Huygens probe landed onto an ancient river or brook.

Image Credit: ESA/NASA/JPL/University of Arizona/Erich Karkoschka.


This view of a portion of Titan's atmosphere was obtained from the Voyager 1 spacecraft on November 12, 1980 at a range of 13700 miles or 22000 kilometers from the Opaque Moon. The image, which is in false color, reveals the details of the haze that covers Saturn's largest moon. One can notice several layers of haze in the upper atmosphere of the Orange Moon. Titan's atmosphere is mostly composed of molecular nitrogen and methane. The interaction between atmospheric compounds and UV light from the Sun can engender new aerosols or new molecules such as organics or hydrocarbons. The upper level of the thick atmosphere or aerosol above the limb of Titan appears orange. The upper limits of the atmosphere reveal blue, detached haze layers in the visible spectrum. Image Credit: NASA/JPL.


The image in the upper part of the table corresponds to one of the frames obtained from the Narrow-Angle Camera of the Cassini probe in the infrared spectrum during the observation campaign for cloud activity on October 29 and October 30, 2016. The view clearly reveals the famous lakes and seas found at high latitudes in the northern hemisphere as well as dynamic clouds close to the lakes or seas and elongated clouds moving around the north polar region at high latitudes.
The series of images acquired from the Cassini probe during this observation campaign was used to produce a video unveiling the movement or the dynamics of clouds taking shape, developing and fading in the high northern latitudes. The movie sequence represents 11 hours with one frame acquired every 20 minutes. The lakes, seas and rivers found in the north polar region may be mainly composed of methane and ethane. The northern hemisphere is now experiencing the end of the Spring season and the Summer season is approaching in the area. Will there be more clouds in the area as the Summer season approaches and develops ?
The image in the lower part of the table corresponds to another frame of the movie sequence revealing the remarkable cloud activity. One can notice the relatively strong dynamics of clouds which can develop, move or fade. Scientists were expecting more cloud activity due to the increasing amount of solar energy reaching the area. The evaporation processes may increase over time engendering more clouds via typical condensation processes.

Image Credit: NASA/JPL-Caltech/Space Science Institute.    


The diagram above illustrates some complex mechanisms that may occur in the stratosphere of Saturn's largest moon Titan and that may engender clouds of dicyanoacetylene (C4N2) ice. A group of researchers led by Carrie Anderson recently released a study formulating the hypothesis of "solid-state" chemistry taking shape inside ice particles to explain the appearance of clouds of dicyanoacetylene in an area where they shouldn't form due to the limited level of vapor pressure. The internal structure of ice particles is made up of cyanoacetylene ice or HC3N ice. An outer shell of hydrogen cyanide ice or HCN ice takes shape above the core of HC3N. The diagram shows a basic mechanism in which a photon or an ultraviolet radiation goes through the outer shell of the ice molecule to break down HC3N molecules, engendering C3N and H. That's the first step. In the second step, the new molecules of C3N interact with HCN to produce C4N2 and H as shown in the "Stage 3" part of the diagram. The team of scientists believes that it is the most likely mechanism to account for the development of those surprising stratospheric clouds even if an hypothesis involving another reaction engendering C4N2 ice and H can't be ruled out.

Image Credit: NASA/JPL-Caltech/GSFC.


The image in the upper part of this table corresponds to a Synthetic Aperture Radar (SAR) view of the Shangri-La Sand Sea obtained from the Radar Mapper of the Cassini probe on July 25, 2016 during the mission's 122nd targeted encounter of the Opaque Moon. Hundreds of linear and parallel sand dunes which appear as dark lines snaking or meandering across the surface can be clearly identified. Those dunes which resemble Seif Dunes on Earth show patterns of undulation and divergence around radar-bright topographic obstacles or elevated mountains. One can infer the direction of prevailing wind and sand transport on the ground. The sands appear to move from left to right or from west to east and they are most of the time deflected by bright topographic obstacles, hills or mountains. They can end their run in chutes or they can be orientated through canyons between the tall topographic features.
They can take the shape of thin, blade-like, isolated dunes between bright elevated terrains or mountains. The dunes tend to erode the natural obstacles and to turn around them to follow their run fuelled by prevailing winds. They first collect into small patchy dunes and they progressively develop to form larger, more pervasive linear shapes, before being eliminated, erased or stopped once again by topographic obstacles.The shape or the structure of the landscape clearly reveals the action or the influence of prevailing winds at the present time or in the past but it also shows the effects of underlying substratum or bedrock and surrounding terrain or topography.
Dunes have been found in several worlds in the Solar System like on Mars and on Titan. Their shape is strongly influenced by prevailing winds. The comparative analysis of dune fields allows us to better understand the underlying topography, winds and climate, in the past and at the present time. A parallel can be drawn between the Seif Dunes of Titan and the dunes observed in the Great Sandy Desert located in Australia. In the Great Sandy Desert, dunes can be seen undulating broadly across the irregular or uneven ground and finishing their course at the margins of sand-trapping lakes. The dune orientation is generally closely related to the direction of current trade winds. The dune orientation suggests that winds must have been similar at the time when the dunes took shape, during the Pleistocene glacial and interglacial periods.
North on Saturn's largest moon appears upward in this view. The radar signal illuminates the landscape from upper right at a 27-degree incidence angle. The radar image in the lower part of this table shows a larger portion of the Shangri-La region unveiling another landscape portion to the northwest and another landscape portion to the southeast. The original radar view was reprocessed via the despeckling or denoising technique in order to generate a clearer view. Thus, researchers can interpret or analyze landscape features more easily. The denoising technique which was performed was described in A. Lucas, JGR:Planets (2014).

Image Credit for the upper view: NASA/JPL-Caltech/ASI.
Image Credit for the lower view: NASA/JPL-Caltech/ASI/Université Paris-Diderot.     


The image in the upper part of this table corresponds to a Synthetic-Aperture Radar view of a portion of Titan's surface. The view was taken from the Radar Mapper of the Cassini probe on July 25, 2016 during the "T-121" Flyby which corresponds to the mission's 122nd targeted encounter of the Opaque Moon. The Radar Mapper was orientated toward the southern latitudes of Saturn's largest moon. The region unveiled here is illuminated by the radar signal from the bottom at a 30-degree incidence angle. The landscape portion is approximately 155 miles high and 310 miles wide or 250 kilometers high and 500 kilometers wide. The region is centered at approximately 30 degrees south latitude and 60 degrees west longitude. The area unveiled here had been nicknamed the "Xanadu annex" by researchers of the Cassini radar team earlier in the mission. That's the first time we get such a view of this intriguing region. The measurements of the brightness temperature of this reflective area obtained from the Microwave Radiometer of the Cassini probe appeared to be quite similar to the brightness temperature measurements of the big, bright area known as Xanadu located just to the north. Concretely, the Radiometer of the Cassini orbiter is essentially a very sensitive thermometer and the brightness temperature is a measure of the level of microwave radiation emitted from a landscape feature to the Radiometer.
The collaborators of the Cassini radar team had previously predicted that this area would appear similar to the bright Xanadu as soon as this region is imaged. The new view shows that their intuition is strengthened or confirmed. The landscape revealed here is composed of mountainous terrains resembling the mountainous area of Xanadu. The continent-sized Xanadu remains an enigmatic feature of Titan's landscape. Its brightness and its shape contrast with the dark low-latitude regions dominated by dunes. Xanadu turns out to be the first landscape feature clearly identified on Titan thanks to the Hubble Space Telescope which imaged it for the first time in 1994 that is to say three years before the launch of the Cassini-Huygens spacecraft from Earth. Scientists used to believe that the bright Xanadu was a raised plateau. However, the new analyses suggest that Xanadu is slightly inclined and not higher than the darker surrounding areas. The dark low latitudes turn out to be dominated by Seif Dunes but Xanadu appears to prevent sand dunes from forming. The view in the lower part of the table shows the same area reprocessed with the despeckling technique to reduce or remove the noise of the original radar data. Thus, landscape features are clearer and easier to interpret. Bright channels or river channels can be clearly identified. A crater-like feature located in the lower left part of the image can be correctly characterized as well. The denoising or despeckling technique used to generate clearer views was described in A. Lucas, JGR:Planets (2014).

Image Credit for the upper view: NASA/JPL-Caltech/ASI.
Image Credit for the lower view: NASA/JPL-Caltech/ASI/Université Paris-Diderot.         


The view above corresponds to an updated map of Saturn's largest moon Titan with the level of imaging coverage available in June 2015. Numerous names of well-known landscape features or key landscape features were incorporated into the map. They represent official names since they have been approved by the International Astronomical Union. The map was produced on the basis of infrared or near-infrared data acquired from the Cassini probe during its journey within the Saturnian System. The map was generated by the USGS Astrogeology Science Center for the International Astronomical Union (IAU) Working Group for Planetary System Nomenclature. Radar data have clearly shown that the dark low-latitude regions such as Shangri-La or Fensal/Aztlan are dominated by Seif Dunes or parallel and linear dunes extending over long distances.

Image Credit: NASA/JPL-Caltech/Space Science Institute/USGS.


The Voyager 2 probe took images of Saturn, Titan and other Saturnian moons 35 years ago. This view of Saturn's largest moon Titan was acquired from the Voyager 2 probe on August 23, 1981 at a distance of about 2.3 million kilometers or 1.4 million miles from the Orange Moon. The color view was generated on the basis of blue, green and violet frames. The atmosphere of this enigmatic moon had been clearly identified in 1944 by Gerard Kuiper who noticed the presence of a significant concentration of atmospheric methane. We now know that Titan's atmosphere is mainly composed of molecular nitrogen with a significant fraction of methane in the Troposphere. Organics such as acetylene, ethane or propane can also be encountered at the level of the surface or near the surface.
During this flyby, one could clearly notice the presence of a dense and thick atmosphere whose opacity in the visible spectrum prevents the outer-space observer from seeing the surface of the moon. A brightness contrast could be identified between the northern hemisphere and the southern hemisphere of the giant moon, the southern hemisphere appearing lighter than the northern hemisphere. A well-defined band could be observed near the equator and a dark north polar cap or ring was clearly seen as well. Those atmospheric bands suggest cloud or haze circulation. One can notice a detached haze layer made up of submicron-size particles in the upper atmosphere of the moon.

Image Credit: NASA/JPL.


The image in the lower part of the table corresponds to a Synthetic-Aperture Radar view of the Titanian landscape taken from the Radar Mapper of the Cassini probe during the T-120 Flyby on June 7, 2016. The area observed here is approximately 60 miles long and 40 miles wide or 100 kilometers long and 70 kilometers wide. The view is centered at approximately 60 degrees south latitude and 130 degrees west longitude. The radar signal illuminates the topography from the left at a 28-degree incidence angle.
The radar view unveils, at its center, an elongated bright feature inclined from upper left to lower right. This stretched bright feature appears to be a long ridge or mountain range with jagged peaks, probably generated by methane rainfall erosion. Some peaks of this mountain range go up approximately 2,400 feet or 800 meters above the valley floor, the relatively dark and uniform area around the bright feature. The mountain range reveals a significantly gentler slope on its left part, where the radar signal is brighter, than on its right side. Mountains which are shaped in the same way on our planet are often fractured blocks of the crust, pushed upward and then inclined, producing a shallow slope on one part and a steeper slope on the other part corresponding to the fractured and faulted rim.
The view in the upper part of the table corresponds to an annotated mosaic confronting this radar view of the Opaque Moon with a radar view of a relatively similar feature found on Earth. The image found on the right part of the mosaic unveils the Dragoon Mountains located in Arizona just east of Tucson. The Dragoon Mountains take the shape of a tilted fault block, shaped via spreading that has taken place across the Western United States. The Dragoon Mountains may resemble the bright elongated feature identified in the radar view of Titan presented here and they may result from the same kind of geological process. The radar view unveiling the Dragoon Mountains was generated using data from NASA's Shuttle Radar Topography Mission. The radar signal illuminates the topography from the left in that image like in the other radar view of Saturn's largest moon.
Researchers are realizing that Titan reveals familiar geological processes associated with crustal interactions. Mountain ranges can take shape or develop. Canyons shaped by liquid methane can form. Dunes, lakes, seas and rivers have been clearly identified on Titan as well. Yet, the Orange Moon unveils an extremely harsh environment where water can't appear in its liquid form on the surface. However, there is a methane cycle with evaporation processes, condensation processes and precipitation processes which can engender strong erosional or dissolution phenomena like on Earth. Scientists believe that there may be fractures in Titan's crust engendering processes of uplift and spreading. There may be a type of plate tectonics on Titan and erosion resulting from liquid methane may strongly influence the shape of the landscape.

Image Credit for the Dragoon Mountains: NASA/JPL-Caltech/NGA.
Image Credit:
NASA/JPL-Caltech/ASI.    


The image in the lower part of the table as well as in the upper left part of the table reveals a Synthetic-Aperture Radar image of the Titanian landscape acquired from the Radar Mapper of the Cassini probe during the T-120 Flyby on June 7, 2016. The view is centered near 47 degrees south and 153 degrees west. The area covered here is 87 miles long and 75 miles wide or 140 kilometers long and 120 kilometers wide. The resolution is approximately 400 meters or 1,300 feet. The radar signal illuminates the landscape from the left at a 35-degree incidence angle.
The topography of the Titanian landscape observed here is known as a "labyrinth terrain". Labyrinth terrains are believed to be higher regions that result from the action of methane rivers which shape, sculpt or cut the landscape via erosion and dissolution processes. The labyrinth terrains were either lifted up or left at the original level as the area around them lowered under the action of liquid hydrocarbons. The radar view reveals several well-defined valley systems which have developed. The valleys may have drained liquids resulting from methane rainfall toward the southeast found at top. One can observe that several of these systems are roughly parallel (orientated from upper left to lower right). This configuration implies that the direction is influenced by the geological structure of the ground or by the local topographic gradient which corresponds to the general slope across the region.
The upper image of the table reveals the annotated version of the radar view on the left part as well as a view of the same kind of terrain found on Earth on the right part. The image of a Terrestrial landscape resembling the labyrinth terrain found on Titan corresponds to an aerial photograph of an area located in southern Java called Gunung Kidul. Geologically, this area is made of limestone that has been dissolved or eroded by water, engendering a network of canyons called polygonal karst. Those terrestrial canyons tend to be orientated from upper left to lower right like on Saturn's largest moon. In that area, the canyons are controlled by faults or joints. The Java photo is from Haryono and Day and can be found in the Journal of Cave and Karst Studies 66 (2004) 62-69 (courtesy of Eko Haryono).

Image Credit: NASA/JPL-Caltech/ASI.    


This view obtained in red light with the Wide-Angle Camera of the Cassini probe on January 26, 2016 reveals a portion of Saturn's rings as well as the Opaque Moon Titan above the rings. One can notice in particular the shadow of the Gas Giant which creates a dark ellipse within a portion of the rings. The camera was orientated toward the sunlit side of the rings from approximately 3 degrees above the ring plane. The image was acquired at a distance of about 1.8 million miles or 2.9 million kilometers from the Orange Moon and at a Sun-Titan-spacecraft, or phase, angle of 84 degrees.
In the view, the northern hemisphere of Titan, currently experiencing the end of the Spring season and approaching the Summer season, is illuminated by the Sun. A portion of the Titanian disc is not illuminated by the Sun. During most of Saturn's long year which lasts almost 30 Terrestrial years, the shadow produced by the globe of Saturn extends well beyond the edge of the A ring. However, in the view, the seasonal configuration, in which the Summer solstice is rapidly approaching in the northern hemisphere, allows the shadow to be shorter and to reach its limits inside the rings because the Sun is sufficiently high in Saturn's sky to enable most of Saturn's A ring to be fully shadow-free.

Image Credit: NASA/JPL-Caltech/Space Science Institute


The diagram above illustrates the complex interactions between the atmosphere of Saturn's largest moon Titan and its surface. The north polar region of the Opaque Moon hosts lakes, seas and rivers whose nature and dynamics are probably closely related to a meteorology involving pure methane and more complex hydrocarbons or organics. A new study led by Alice Le Gall suggests or confirms that Ligeia Mare, one of the three major seas found in the high latitudes of the northern hemisphere, is mostly composed of pure liquid methane. Researchers think that ethane molecules and more complex organics or heavier molecules may migrate toward the sea floor forming a sludge layer. The sludge located at the bottom of Ligeia Mare may be rich in organics.
A complex chemistry involving nitrogen, methane, organics or other hydrocarbons takes shape in the upper atmosphere of Titan under the action of ultraviolet light which engenders a lego game producing new molecules from simple ones to more complex molecules which will tend to fall to the lower atmosphere or to the surface. The organics or hydrocarbons can fall as rain, as snow, as dust or can move via rivers. Some molecules will be dissolved in the sea of liquid methane and some insoluble molecules such as nitriles and benzene will tend to sink to the sea floor fuelling the sludge which is supposed to accumulate at the bottom of Ligeia Mare as Cassini data imply.

Image Credit: ESA.


This view obtained from the Narrow-Angle Camera of the Cassini probe in red light on June 10, 2006 reveals a portion of the magnificent rings of the Gas Giant Saturn as well as the Opaque Moon Titan and the icy moon Enceladus. The largest disc in this view corresponds to Titan which is by far the largest moon of Saturn. Titan is the second largest moon in the Solar System with a diameter of about 5150 km. The small dark disc appearing in the lower right part of Titan's disc corresponds to the bright icy moon Enceladus whose diameter is only about 505 km. North appears in the upper part of the image. For this view, the probe was located 3.9 million km from Enceladus and 5.3 million km from the Orange Moon Titan.
Titan has the particularity of having a deep, thick, dense and opaque atmosphere made of an organic haze. The solar light refracted through the Titanian atmosphere allows us to clearly discern the gas blanket covering the giant moon. The Huygens probe of ESA performed a successful landing, in the region of Adiri and Shangri-La, on January 14, 2005 and collected the first images of Titan's surface. Bright hills made of dark fractures and contrasting with the brown or orange plain were observed. Enceladus has the particularity of hosting geysers which take shape through cracks or fractures known as Tiger Stripes in the south polar region. Therefore, researchers believe that a subsurface ocean or pockets of liquid water may hide beneath the icy crust of the small, bright moon. Two main hypotheses can be put forward regarding the origin of the Saturnian rings. The rings may have been produced during the planetary formation process via aggregation or accretion phenomena or they may be the outcome of the disintegration of a former moon related to the fact that it strayed too close to the Gas Giant.

Image Credit: NASA/JPL/Space Science Institute


The two images of this table are montages revealing different types of map for each side of Titan as well as a particular portion of the landscape. The synthetic views of the disk of the Opaque Moon cover the entire globe. The hemispheric view unveiled in the upper image of the table shows, in particular, the area of Adiri and Shangri-La. The views over the disk focus on the area where the Huygens probe landed in 2005. The hemispheric view unveiled in the lower image of the table shows, in particular, the area of Fensal-Aztlan. The views over the disk focus on the 50-mile-wide or 80-kilometer-wide Sinlap impact crater.
The maps were generated on the basis of data obtained from the Visual and Infrared Mapping Spectrometer of the Cassini probe between 2004 and 2015. Scientists are now in a position to produce smooth-looking maps of Saturn's largest moon on the basis of a large array of different VIMS observations performed under different lighting and viewing conditions. Since the arrival of the Cassini probe into the Saturn System in mid-2004, the Cassini spacecraft has flown past the Orange Moon about once per month, on average, in order to collect different types of data and to benefit from its gravity for modifying the trajectory of the probe. As a result, a large number of observations carried out by the VIMS instrument was made and the puzzle of the map is regularly improved or completed.
The deep, hazy and opaque atmosphere of Titan makes the analysis and the observations of Titan's surface particularly difficult. Generating a seamless global map of this giant moon represents a challenge for researchers because observing conditions can be very different between each observation campaign. Scientists must take multiple factors into account such as the changes in the angle of the Sun relative to the surface and the changes in the probe's viewing direction. Thus, they manage to erase or reduce the effects of scattering and absorption of light by the hazy and opaque atmosphere of the Orange Moon. The brightness level of surface features can be influenced by those phenomena. Researchers must also consider potential variations in the appearance of Titan's surface related to seasonal changes since the start of the mission in 2004. During the long mission of the Cassini spacecraft, we have collected data during the Winter season in the northern hemisphere and during the Spring season in the northern hemisphere. Reproducing a correct view of the surface turns out to be a complicated task due to the multitude of complex factors which can influence the appearance of the landscape.
Each montage reveals, from left to right in each row, 4 different types of view based on the data from the VIMS instrument of the Cassini probe. Each image demonstrates the large spectral capability of the device. In each montage, the image on the left unveils the surface at 2 microns, a wavelength belonging to the infrared spectrum which allows the observer to see through the opaque atmosphere down to the surface. The second image from the left corresponds to a spectral ratio view. In that configuration, a view at one wavelength is divided by an image at another wavelength. This technique is well suited for revealing subtle spectral variations on the ground. Some variations can result from differences in composition. The third image from the left represents a color composite with light at 5 microns appearing red, light at 2 microns appearing green and light at 1.27 microns appearing blue. Let's point out that all component views were corrected to eliminate atmospheric and photometric effects. The fourth view from the left represents a color composite produced using ratios that divide the brightness of the surface in one set or band of wavelengths by that of another set or band of wavelengths in order to generate the red, green and blue channels of a color composite view. Thus, the final view may reveal differences in the nature of surface compounds like in the configuration of spectral ratio views.

Image Credit: NASA/JPL-Caltech/University of Arizona/LPGNantes.    


The three radar images of this table reveal a mountainous region of Saturn's largest moon Titan. This mountainous region known as Mithrim Montes is composed of three ridges which are roughly parallel. The tallest peak of the Hazy Moon is found in this region, midway along the lower ridge unveiled in this radar portion obtained from the Radar Mapper of the Cassini probe. The annotated radar image of this table shows the exact location of the peak which has an elevation of 3,337 meters or 10,948 feet.
The upper view and the view in the middle of the table correspond to reprocessed radar images of the area based on the "Despeckling Technique". The Despeckling Technique allows researchers to remove the noise or the grainy aspect of the radar image and to produce a clearer view or a view which is easier to interpret. The radar image appearing in the lower part of the table corresponds to the radar image produced with the standard processing and unveiling a strong noise. The radar image was captured by the Radar Mapper of the Cassini probe on May 12, 2008 during the flyby of Titan named T-43. The view is centered at 2 degrees south latitude and 127 degrees west longitude and the incidence angle is approximately 34 degrees.
Let's recall that radar images are not optical views based on sunlight. Radar views are based on radio waves beamed by the probe and reflected and scattered off of the surface of the Opaque Moon. Thus, we are in a position to see through the opaque atmosphere and to identify surface features or brightness variations on the surface. Bright regions will tend to indicate a reflective surface or a rough material whereas dark regions will tend to indicate a surface which has a strong absorption power or a relatively smooth surface. Therefore, the pools of liquids appear dark because they are relatively smooth and they absorb a lot. This technique based on radio waves engenders some noise or a grainy pattern which can be corrected via the Despeckling Technique.
Scientists were quite surprised to see that mountains on Titan could be as high as the highest peak of Mithrim Montes which can rival many significant peaks on Earth. Let's point out that the highest peak on Earth is Mount Everest which is more than 5 miles high or nearly 9 kilometers high. Researchers believe that the water-ice bedrock found at a great depth below the Titanian surface is softer than rock on Earth. That's why the presence of relatively high mountains on Titan can be surprising.
Scientists believe that, beneath the icy crust of Titan, there is a deep ocean of liquid water which is probably similar, in terms of dynamics, to the Earth's upper mantle made of a relatively fluid layer, a layer of hot, high-pressure rock that can slowly move, flow and deform over time. Once the period of mountain development comes to an end, the fluid layer corresponding to the internal ocean enables the crust to relax like an individual laying down onto a waterbed. The presence of big mountains on the Opaque Moon implies that some active tectonic forces could shape or deform the surface. Tidal forces exerted by the Gas Giant Saturn may play a role in this presumed active tectonic activity. The cooling phenomenon of the crust as well as Titan's rotation may also account for this surprising tectonic activity.

Image Credit: NASA/JPL-Caltech/ASI.


This mosaic corresponds to an updated map of Titan. The map is composed of data acquired from the Radar Mapper and from the Visual and Infrared Mapping Spectrometer of the Cassini probe. Therefore, the map incorporates radar data as well as infrared or near-infrared data. The map unveils the locations of mountains that have been named by the International Astronomical Union. The mountains are indicated by a yellow circle connected to their name. The previous version of that kind of map was released in 2012.
The new map incorporates an additional mountain area known as Moria Montes as well as several "colles" which represent collections of hills. The names of the mountains of Saturn's largest moon are, by convention, based on the names of the mountains from Middle-earth, the legendary place in fantasy novels by John Ronald Reuel Tolkien. Let's point out, for the fans of "Lord of the Rings", that the highest peak of the Orange Moon is not Doom Mons. Colles on Saturn's largest moon are named for characters from the same story of John Ronald Reuel Tolkien.

Image Credit: NASA/JPL-Caltech/University of Arizona/USGS.


The mosaic shown in the upper part of this table reveals the evolution of a mysterious transient feature known as the "Magic Island" in Ligeia Mare, the second largest sea present in the high latitudes of Titan's northern hemisphere. The radar images were obtained with the Radar Mapper of the Cassini probe during its tour in the Saturn System. The dark areas correspond to liquid portions which are thought to be mainly composed of a mixture of liquid methane and liquid ethane. Methane and ethane are hydrocarbons which can appear in their liquid form on Saturn's largest moon.
The mosaic shown in the middle of the table represents the annotated view of the mosaic unveiled in the upper part of the table. The mosaic shown in the lower part of the table corresponds to the same radar data without annotations and without the artificial colors which are shown in the first mosaic and the second mosaic presented in the upper part of the table. One can clearly notice, on the basis of the radar views displayed on the left column, the evolution of a bright transient feature close to the coast of Ligeia Mare from the data taken during flybys in 2007, 2013, 2014 and 2015.
The feature which looks like an island or an archipelago is clearly visible in the radar portion of July 10, 2013. The feature was absent or was not visible in a previous radar view of the area acquired on April 26, 2007. The feature has a different shape and seems to be diluting in the radar image obtained on August 21, 2014. In the radar view obtained on January 11, 2015 from the Cassini spacecraft, the enigmatic feature seems to have completely vanished. What Happened ?
The same kind of ephemeral or transient feature has already been observed elsewhere in Ligeia Mare as well as in the largest sea of the north polar region Kraken Mare. The multiple observations of the same areas demonstrate that the seas or lakes of Titan's northern hemisphere are dynamic places and not stagnant environments. Mysterious active processes take shape in this exotic environment as the analyses and the radar data show.
Was the Magic Island really an island ? The researchers put forward several hypotheses. The brightening of Ligeia Mare close to the coast may be related to waves, to a boiling area, to solids such as icebergs or to solids present beneath the surface of the sea or lake. The transient brightening may also be due to bubbles. Is a cryovolcanic source responsible for that phenomenon ? Currently, the dominating hypothesis is the scenario of waves. Scientists don't really believe that tides, sea level and sea floor changes can account for the enigmatic phenomenon. They will have another opportunity to gather new clues regarding the transient feature in Ligeia Mare during the final close flyby of the Opaque Moon performed by the Cassini probe in April 2017.
The large radar portion on the right part of each mosaic unveils the full view of the sea or the giant lake Ligeia Mare whose total area is approximately 50,000 square miles or 130,000 square kilometers. Therefore, Ligeia Mare appears to be 50 percent larger than Lake Superior on Earth. The full view of Ligeia Mare corresponds to a mosaic incorporating five Synthetic Aperture Radar images obtained from the Cassini probe between 2007 and 2014. The region unveiled is about 330 by 305 miles in area or 530 by 490 kilometers in area. This mosaic is a new version of a previous mosaic of the same area. The new mosaic incorporates new data which fill in some gaps in coverage and there is an improvement in the quality of coverage in some areas of the view. Let's recall that the colors are artificial. They have been incorporated for aesthetical appeal. Therefore, they have no scientific value.

Image Credit: NASA/JPL-Caltech/ASI/Cornell.


The image in the upper part of this table reveals a sequence of temperature maps of Saturn's largest moon Titan at two-year intervals, from the year 2004 to the year 2016. One can clearly notice varying surface temperatures depending on latitude at any time. The measurements were performed by the Composite Infrared Spectrometer or CIRS instrument which is one of the instruments of the Cassini probe.
The maps were produced on the basis of data on Titan's surface at a wavelength of 19 microns. This wavelength corresponds to a spectral window at which the surface can be characterized despite the natural opacity of the orange atmosphere. As a result, researchers are in a position to measure thermal infrared radiation or heat emanating from the surface.
The goal of scientists was to reveal temperature variations or differences depending on latitude as well as temperature variations at any latitude level of the globe over time. That's why surface temperatures have been averaged longitudinally from east to west at any place where data had been obtained. Therefore, one can clearly notice the seasonal variation across latitudes from north to south. The black areas in the maps correspond to regions where there was not any data collected.
The evolution of surface temperatures on the Opaque Moon is slow and particularly weak over the course of a Titanian year. The Titanian year corresponds to the Saturnian year which lasts approximately 30 Terrestrial years. Thus, each Titanian season lasts about seven and a half Terrestrial years. The amount of solar energy received at each latitude is closely related to the orientation of the sun's illumination which progressively moves northward or southward as seasons advance.
When the Cassini probe entered the Saturn System in mid-2004, the southern hemisphere of the Orange Moon was experiencing the late Summer whereas the northern hemisphere was experiencing the late Winter. As a result, the southern hemisphere appeared to be the warmest region. The equinox occurred in 2009. Thus, in 2009, the southern hemisphere started to experience the Autumn season whereas the northern hemisphere started to experience the Spring season. In 2010, the thermal configuration was similar to the thermal configuration when the Voyager 1 probe observed Titan in 1980, one Titanian year earlier. At that time, in 2010, temperatures were symmetrical between the northern hemisphere and the southern hemisphere. As the Winter season approaches in the southern hemisphere, temperatures tend to progressively diminish. As the Summer season approaches in the northern hemisphere, temperatures tend, on ther other hand, to progressively rise.
The temperature measurements appear to be quite delicate to obtain because of the dense and opaque atmosphere made of an orange haze which adds noise to the measurement and which makes the measurement complicated. The maps show the overall temperature variation or shift. However, let's note that a narrow banding in several locations is related to an artifact of performing the observations through the opaque atmosphere.
The two images in the lower part of the table are part of an animation revealing the evolution of surface temperatures on the Titanian globe from the beginning of the mission in 2004 to 2016. The temperature maps are based on a simplified model of the geographic temperature data depending on time at yearly intervals. In order to clearly unveil temperature variations depending on latitude as well as the peak temperature, the researchers have smoothed the latitude banding. Therefore, one can notice that the peak temperature moves from 19 degrees south latitude to 16 degrees north latitude between the year 2004 and the year 2016.
The small globe found in the upper right part of each image  reveals the view of Saturn's largest moon as observed from the direction of the sun. The yellow arrow reveals the subsolar latitude of Titan that is to say the latitude at which the sun appears directly overhead. This is the area where the solar energy received is supposed to be higher and where the environmental temperature should be higher than in other latitudes. In practice, the maximum measured temperature at the level of the surface of the Orange Moon is around -292 degrees Fahrenheit, -179.6 degrees Celsius or 93.6 Kelvin. The maximum temperature will tend to move in latitude as seasons advance. The minimum temperature found at the Winter pole turns out to be 6 degrees Fahrenheit, 3.5 degrees Celsius or Kelvin colder.
This temperature contrast between the highest temperature and the lowest temperature is particularly weak or narrow compared to the temperature contrast on Earth. The temperature shift between the warmest location on Earth and the coldest location on Earth can be more than 200 degrees Fahrenheit or more than 100 degrees Celsius which is clearly higher than that of Titan. The surface temperature maps presented here correspond to a visualization of measurements that were presented by D.E. Jennings et al. in a publication entitled "Surface Temperatures On Titan During Northern Winter and Spring" in the Astrophysical Journal Letters, Volume 816, L17, in 2016.          

Image Credit: NASA/JPL-Caltech/GSFC.


Titan Images 2015
Titan Images 2014
Titan Images 2013
Titan Images 2012

Titan Images 2011
Titan Images 2010
Titan Images 2009
Titan Images 2008
Titan Images 2007
Titan Images 2006
Titan Images 2005, 2004

Back to main page