Titan Images 2007
 |
|
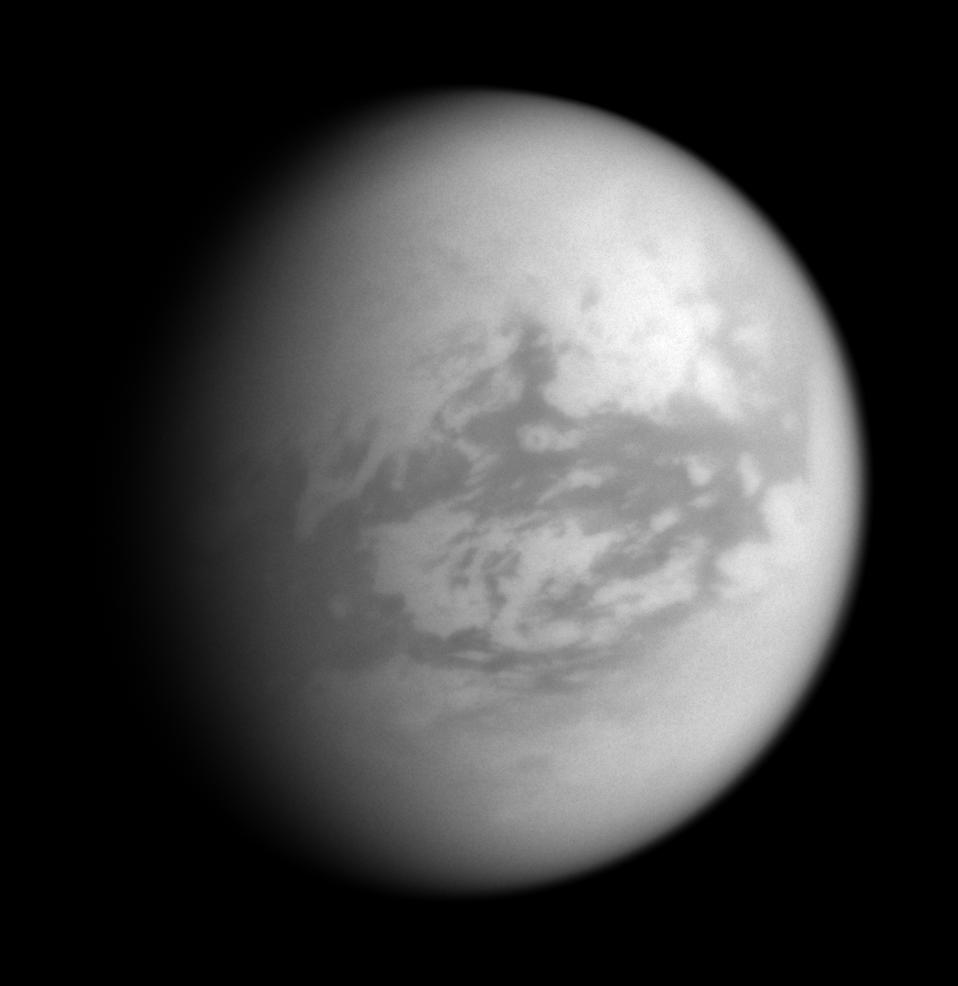
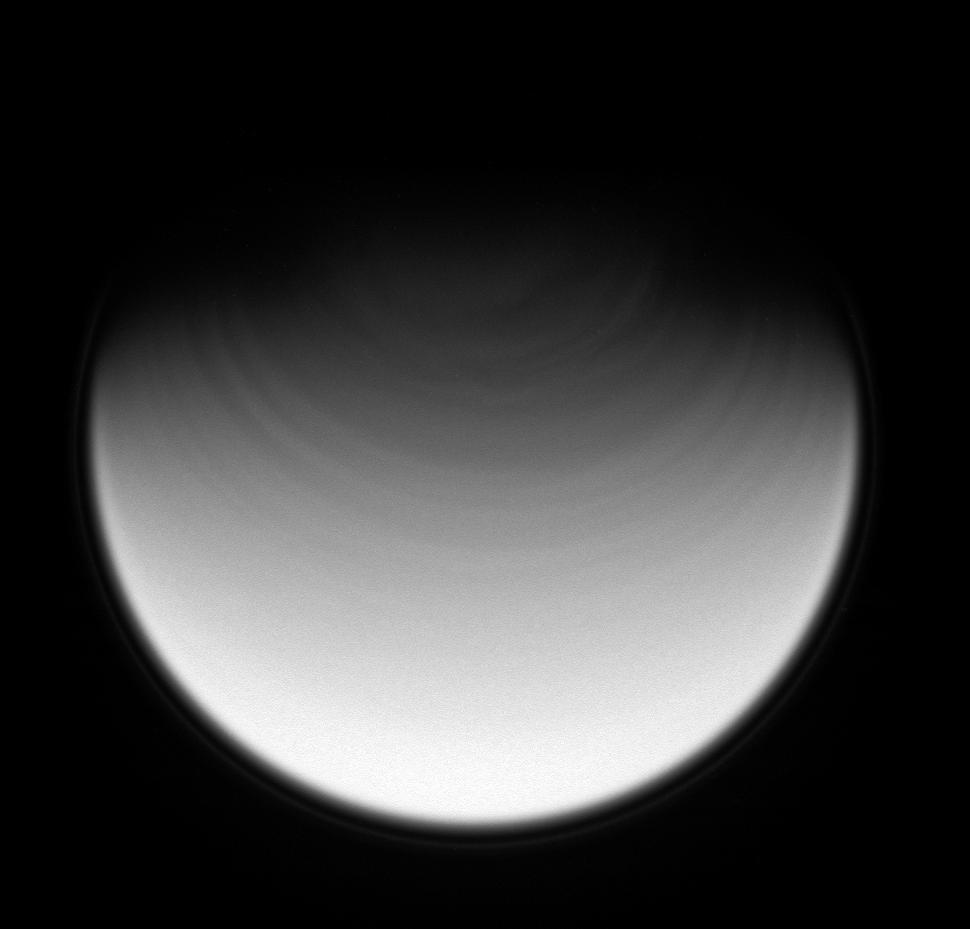
This infrared view of Titan was captured with the Cassini probe wide-angle camera on November 19, 2007 using a spectral filter sensitive to wavelengths of infrared light centered at 939 nanometers. The image presents Titan so that north is up and rotated 21 degrees to the left. From the west to the east, one can notice a portion of Belet, the dark region to the left, the equatorial bright region of Adiri appearing in the middle of the view and on the area which is opposite to Saturn and the dark region of Shangri-La to the east of Adiri. The Huygens probe landing site can be spotted in the north east of Adiri. A previous infrared image of Titan acquired from a roughly similar position had revealed Cirrus-like clouds in the southern hemisphere. This view doesn't show any clear sign of those mid latitude clouds. Image source: NASA,
JPL |
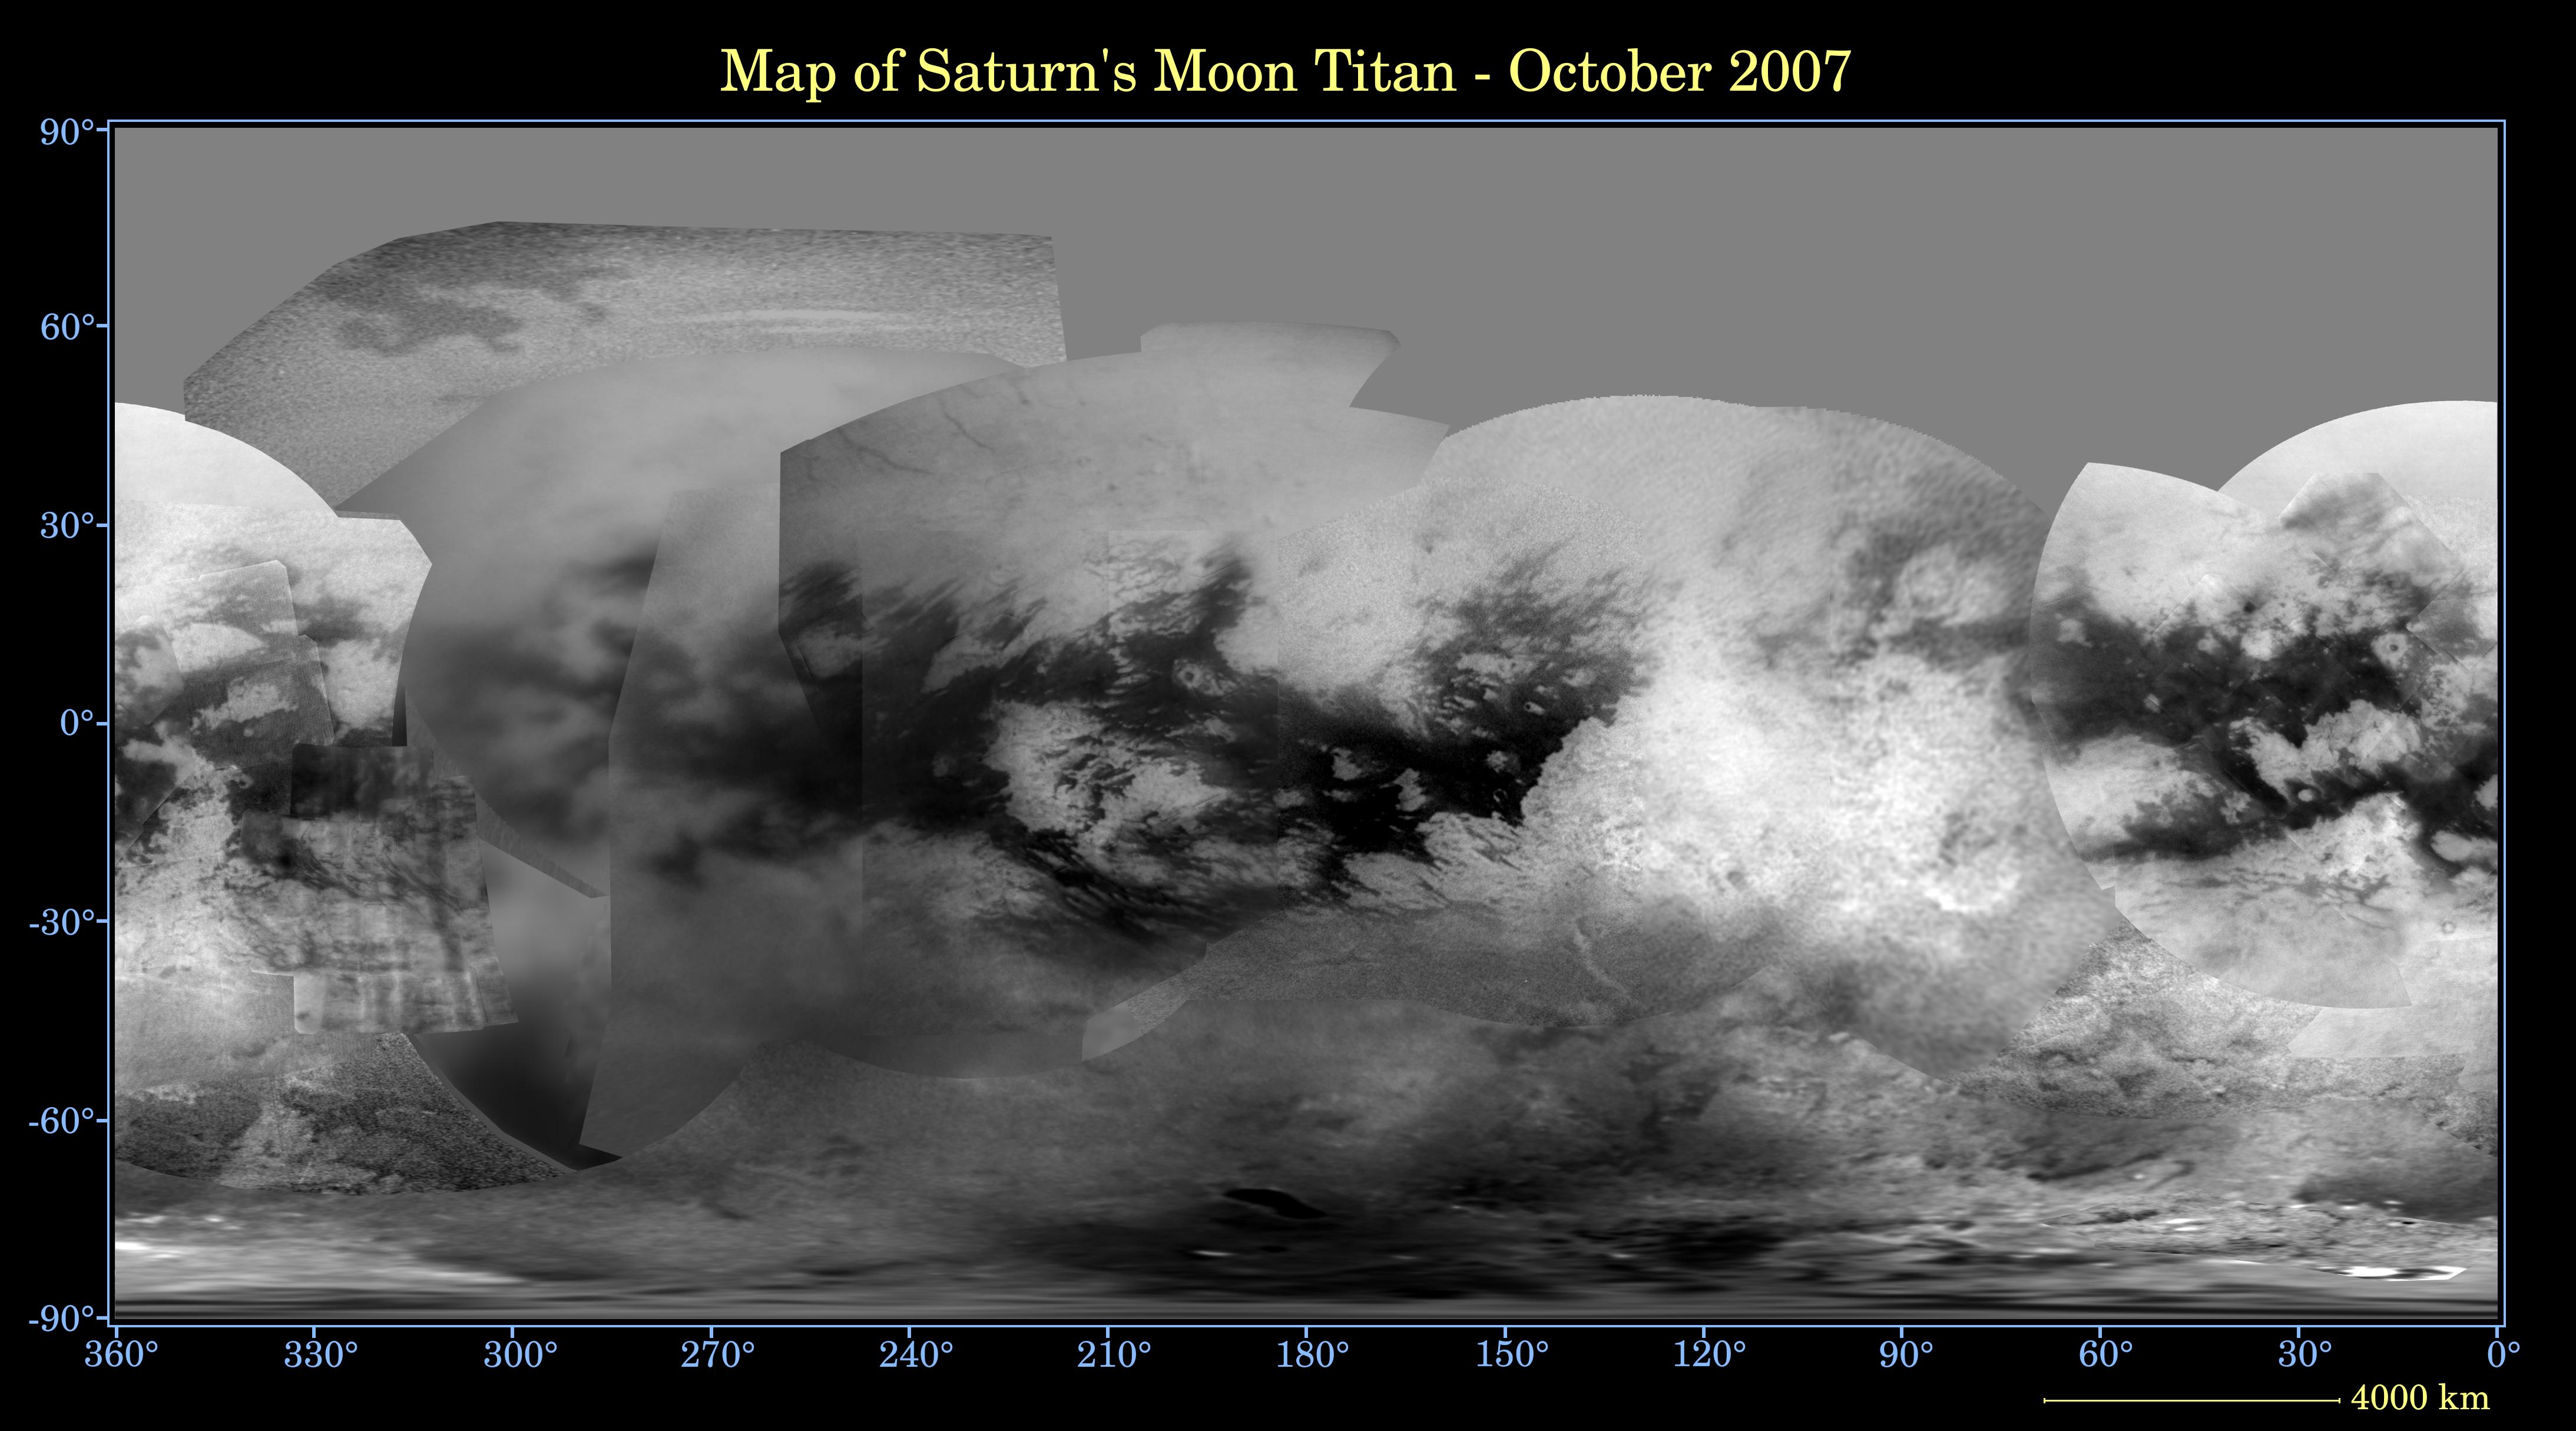 |
This updated infrared map of Titan notably
reveals new details of Titan's north polar region. The infrared mosaic
was created using views taken by the Cassini spacecraft imaging science
subsystem. The images were captured using a filter centered at 938
nanometers in order to pierce Titan's veil and reveal topographic
features or albedo variations across the surface of Titan. No topographic
shading can be identified due to the scattering of light by Titan's
dense atmosphere. Image source: NASA, JPL |
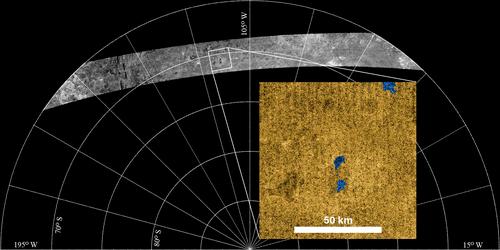 |
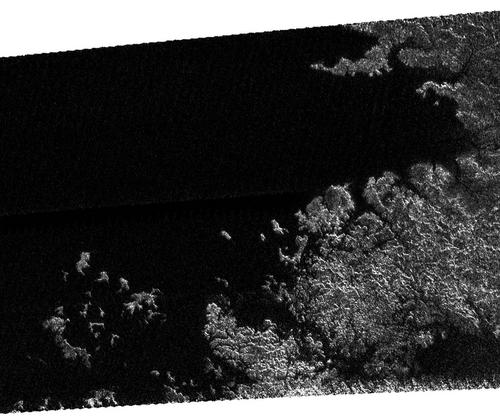
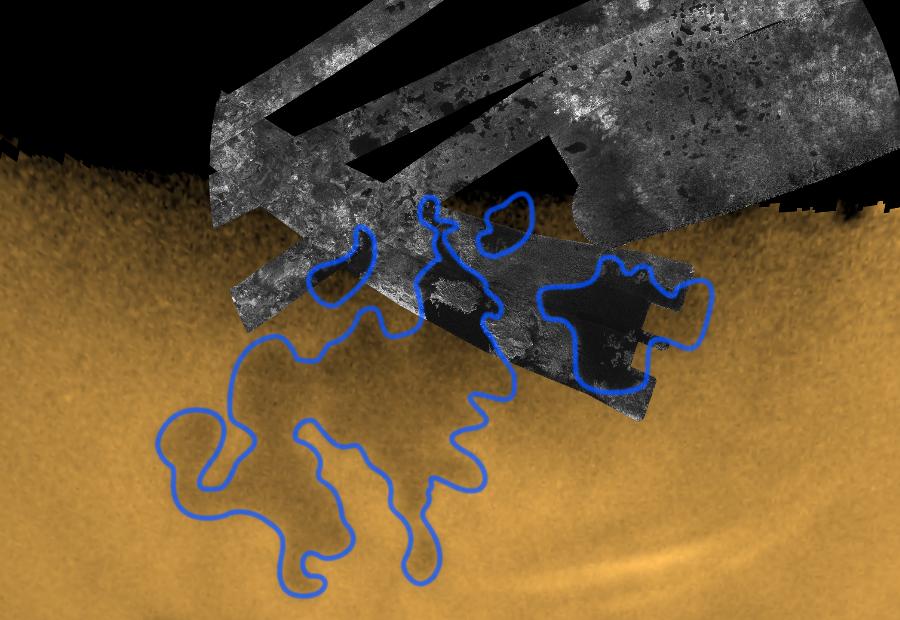
This mosaic reveals the first radar images of Titan's south polar region. The radar swath was acquired with the Cassini Radar Mapper during the 37th Titan flyby on October 2, 2007. The radar strip is 4,500 kilometers long ( 3,800 miles ) and 150 kilometers ( 93 miles ) wide at the narrowest point. The zoom is 90 by 90 kilometers ( 56 by 56 miles ), centered at 70.5 degrees south and 113.9 degrees west. The insert is in false color. It reveals the presence of lakes, tinted blue, at about 70 degrees south. We know, now, that the north polar region is not the only place covered by hydrocarbon lakes or seas. The south polar region is currently in the summer season. The radar swath also includes broad, steep-sided depressions adjoined to sinuous depressions, interpreted to be empty topographic basins or drained lakes fed by channels, and complex mottled terrain, akin to those at similar latitudes. The future flybys will map closer to the south pole. As a result, other bodies of liquid, lakes or seas are expected to be found. Image source: NASA, JPL |
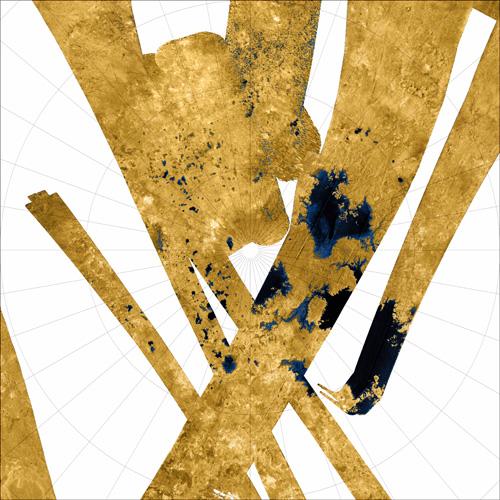 |
This Cassini false-color radar view is a mosaic
assembled with all the synthetic-aperture radar images to date of
Titan's north polar
region. The blue and dark features on this image appear to be bodies
of liquid methane, ethane or dissolved nitrogen. That's why they
are tinted blue or black. A black patch is a lake likely deeper than
a blue
patch
because
it
absorbs more the radar signal. Let's point out that these artificial
colors can be very different from the true color. The radar-bright
areas are tinted brown because they are thought to represent solid
surface. The terrain in the top center of this composite view is
imaged at lower resolution than the remainder of the image. Image source: NASA, JPL |
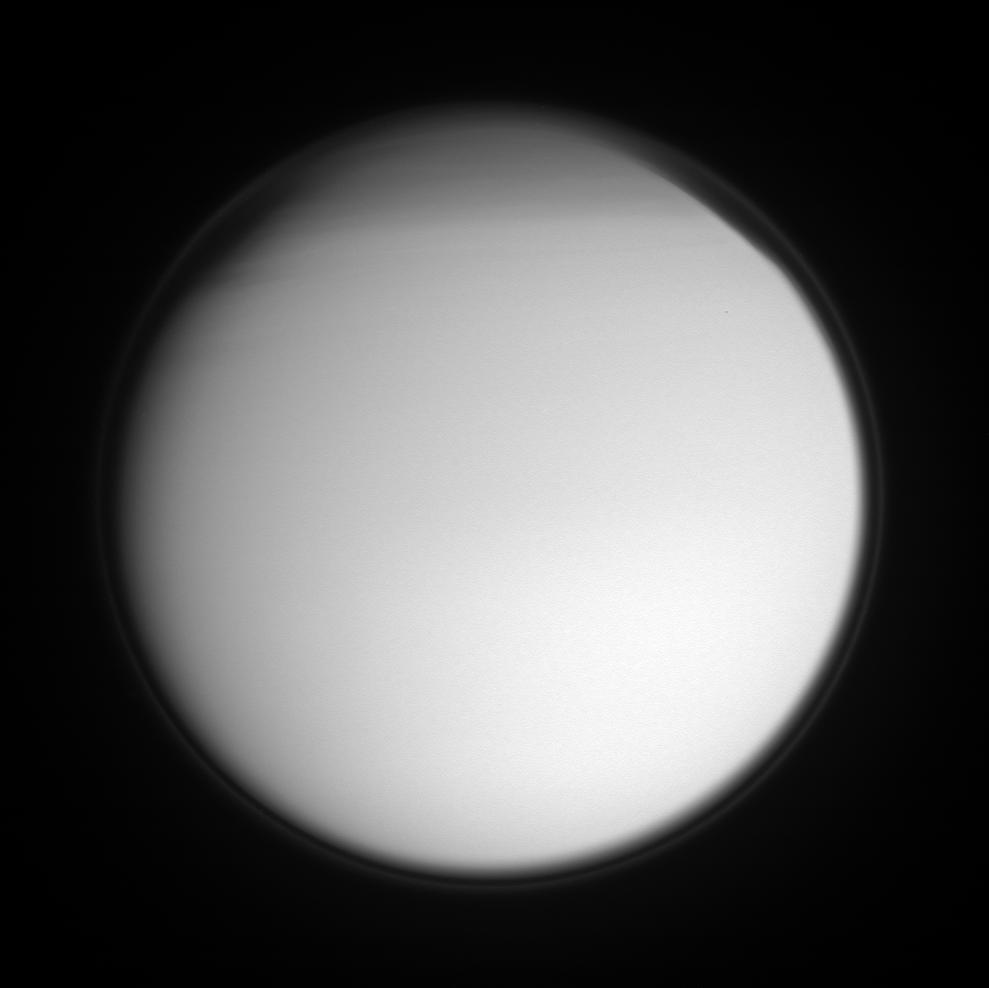 |
This ultraviolet image of Titan was captured
with the Cassini spacecraft narrow-angle camera on September 2, 2007
using a spectral filter sensitive to wavelengths of ultraviolet light
centered at 338 nanometers. The view was acquired at a distance of
roughly 1.3 million kilometers or 816,000 miles from Titan and at
a Sun-Titan-spacecraft, or phase, angle of 20 degrees. Image source: NASA, JPL |
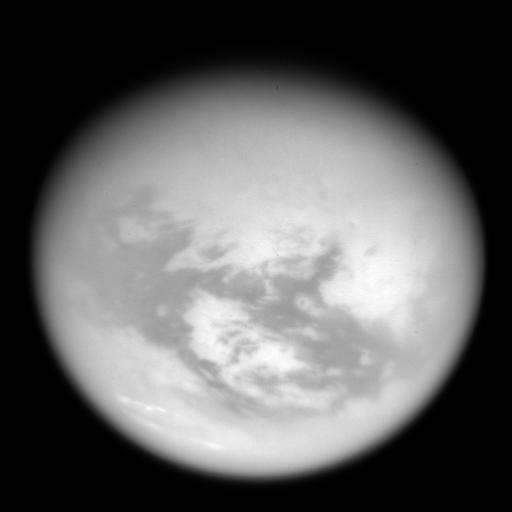 |
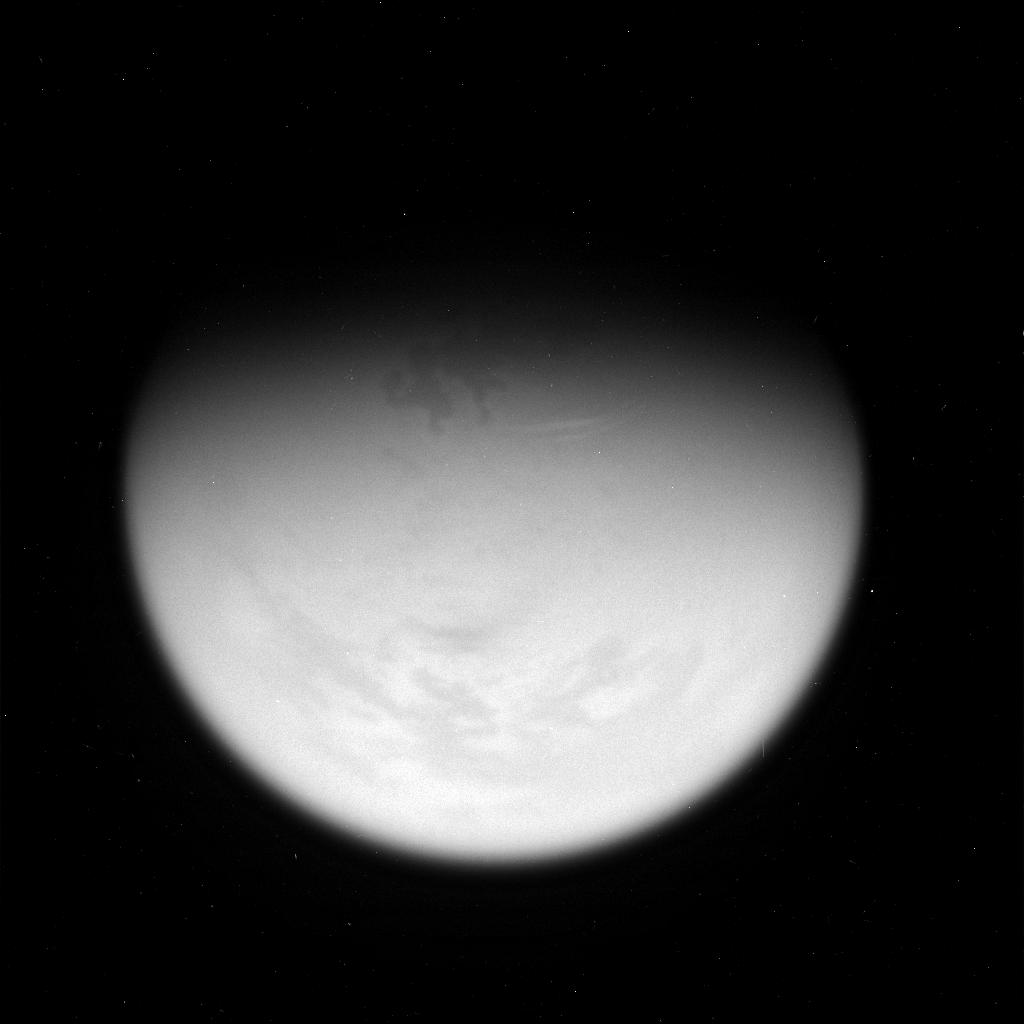
This infrared view of Titan was captured with the Cassini spacecraft wide-angle camera on May 13, 2007. It combines multiple images taken using a combination of spectral filters sensitive to wavelengths of infrared light centered at 939 and 742 nanometers. The rotation axis is inclined 15 degrees to the right and north is up. The area shown is in Titan's trailing hemisphere. One can observe Adiri at the center of the dark portion, a 1,700 kilometer ( 1,050 mile ) wide bright region.The dark regions of Shangri-La and Fensal / Aztlan appear on the eastern part of Adiri and the dark region of Belet is on the west part. One of the noteworthy features in this image is the presence of bright mid-latitude clouds on the lower part of the moon. The cloud bands are long and thin and seem to follow the direction of dominating winds from the west to the east. Image source: NASA, JPL |
 |
This radar view was captured by the Cassini spacecraft
during its 31st flyby of Titan ( T30 ) on May 12, 2007. The portion
as shown is about 160 kilometers ( 100 miles ) by 270 kilometers (
170 miles ). The image is centered near 70 degrees north latitude and
310 degrees west longitude. Image source: NASA, JPL |
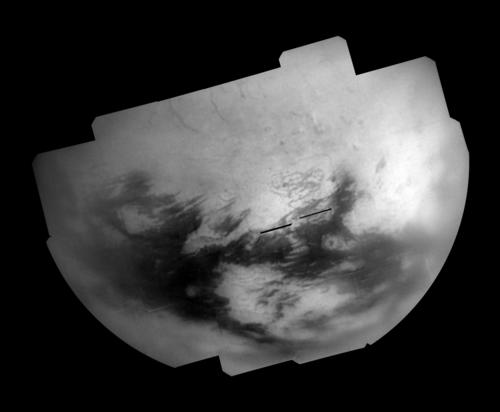 |
This infrared mosaic of Titan was composed
on the basis of the T28 flyby in April 2007. It consists of 29 separate
frames using a total of 116 images. The views used for the mosaic
were
acquired on April 11, 2007. The image is centered on the northern
part of Titan's trailing hemisphere ( near
31.2 degrees
North,
220.7
degrees
West ).
The bright patch at bottom center near the dark area is the region
of Adiri, in the eastern part of the dark area called Belet. The
dark area is located at low latitudes. The radar images have shown
that
the dark areas are dominated by dunes , especially near the equator,
formed by dominating winds which blow from the west to the east.
Some linear bright landscape features in the dark region tend to
indicate
that their shape is strongly linked to powerful winds. A dark spot
surrounded by a bright material can be identified in the east part
of the dark area. It's either the outcome of a meteoritic impact
or the outcome of a cryovolcano. The material expelled is likely
water
ice, carbon dioxyde, ammonia or a substance made of hydrocarbon
molecules. Image source: NASA, JPL |
 |
This ultraviolet view of Titan's northern latitudes was acquired with the Cassini spacecraft narrow-angle camera using a combination of spectral filters sensitive to wavelengths of polarized ultraviolet light. The image was taken on February 25, 2007 at a distance of approximately 1.3 million kilometers ( 800,000 miles ) from Titan and at a Sun-Titan-spacecraft, or phase, angle of 63 degrees. It was obtained from around 50 degrees above Titan's equatorial plane. The ultraviolet view unveils some atmospheric phenomena in Titan's stratosphere: a multitude of circumpolar bands are clearly visible.They are interpreted as cloud streaks moving around Titan's north pole. Those atmospheric features indicate a superrotation process which reminds us of atmospheric currents on Saturn and Venus. Hence, new details of the moon's stratosphere were obtained by using the ultraviolet spectral filter. Image source: NASA, JPL |
 |
This composite view of Titan's north polar region
is part of a movie combining a near-natural color view, an infrared
view and radar images.It was obtained by the Cassini spacecraft narrow-angle
camera on February 25, 2007, at a distance of about 1.3 million kilometers
( 800,000 miles ) from Titan. The infrared views were captured with
a special filter centered at 938 nanometers which allows us to peer
through the orange, hazy and opaque atmosphere. The near natural color
appearance was generated via images taken at 619, 568 and 440 nanometers.
The radar data were obtained in synthetic aperture radar mode. Image source: NASA, JPL |
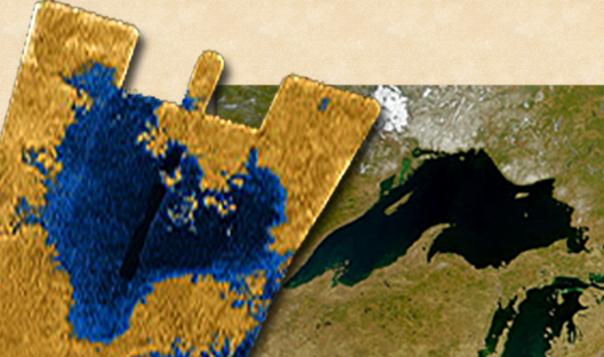 |
This composite image shows, side by side, Lake
Superior on the right and what appears to be the largest body of liquid
ever found on Titan's north pole ( left part ). The Cassini radar image
on the left is a false-color view and the blue extent represents the
assumed lake which is at least 100,000 square kilometers ( 39,000 square
miles ). That's greater in extent than Lake Superior ( 82,000 square
kilometers or 32,000 square miles ), one of Earth's largest lakes.
The view on the right is from the SeaWiFS project, NASA's Goddard Space
Flight Center, Greenbelt, Md. Image source: NASA, JPL |
 |
This infrared image of Titan was captured during the flyby of February 25, 2007. It shows another striking feature in Titan's north pole. In the upper part of this view, a dark area with well defined boundaries can be spotted. It is apparently a giant lake or a sea roughly 1,100 kilometers ( 680 miles ) long. Its surface area is slightly smaller than that of Earth's largest lake, the Caspian Sea. Cloud streaks are clearly visible at about 60 degrees north latitude. The bright cirrus-like clouds are located close to the eastern part of the assumed sea. This sea appears largely bigger than "Ontario Lacus", the dark patch identified in Titan's south pole. Image source: NASA, JPL |
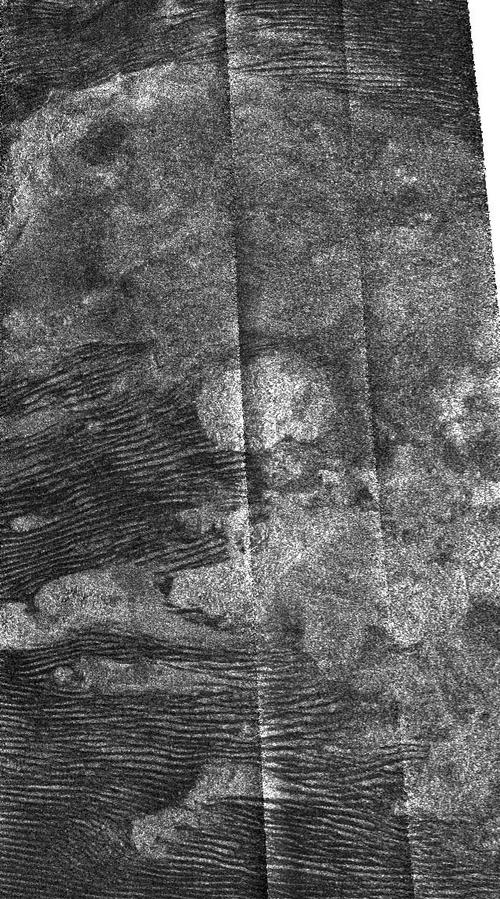 |
This radar image was taken by Cassini's radar instrument in synthetic aperture mode during a near-polar flyby on February 22, 2007. The view is centered at around 3.5 degrees south latitude and 37.3 degrees west longitude in the Fensal / Aztlan region, a landscape feature which looks like the letter "H" in infrared views. North is toward the left. One can clearly see, in this portion, how the prevailing winds shape the landscape: the long, dark and bright streaks are likely sand dunes made up of small hydrocarbon or water ice particles, probably about 250 microns in diameter, similar to sand grains on Earth. The landscape characteristics suggest that prevailing winds blow from the west to the east. The bright patches seem to be topographic obstacles to the winds. The bright patch in the lower part of the image is distorted by the dunes and it deflects the linear movement of the dune formations which flow through and around it. In the upper part of the image, the bright patch appears to stop prevailing winds from acting on the shape of the landscape. It must be composed of hills or elevated terrains. Image source: NASA, JPL |
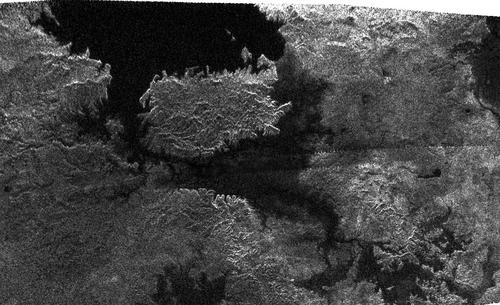 |
This radar image was acquired by Cassini's
radar instrument in synthetic aperture mode during a near-polar flyby
on
February 22, 2007. The view is centered at around 79 degrees north
and 310 degrees west. North is toward the left. A very large lake,
surrounding a big island or peninsula, appears. The island is around
90 kilometers ( 62 miles ) by 150 kilometers ( 93 miles ) across.
That's roughly the size of Kodiak Island in Alaska or the Big Island
of Hawaii.
The portion of the lake above the island, almost 250 km long ( 156
miles ), appears deep since it is uniformly dark and the shoreline
is not progressive. The southern part of the lake in the south coast
of the big island seems shallow because it is less reflective than
the rest of the lake in this radar image.We can find similarities
between these topographic features and landscape features on Earth:
one can
observe, notably, some drainage channels with branching structures,
archipelagos as well as a kind of reef. The bright structures are
likely elevated
terrain, hills or mountains. Image source: NASA, JPL |
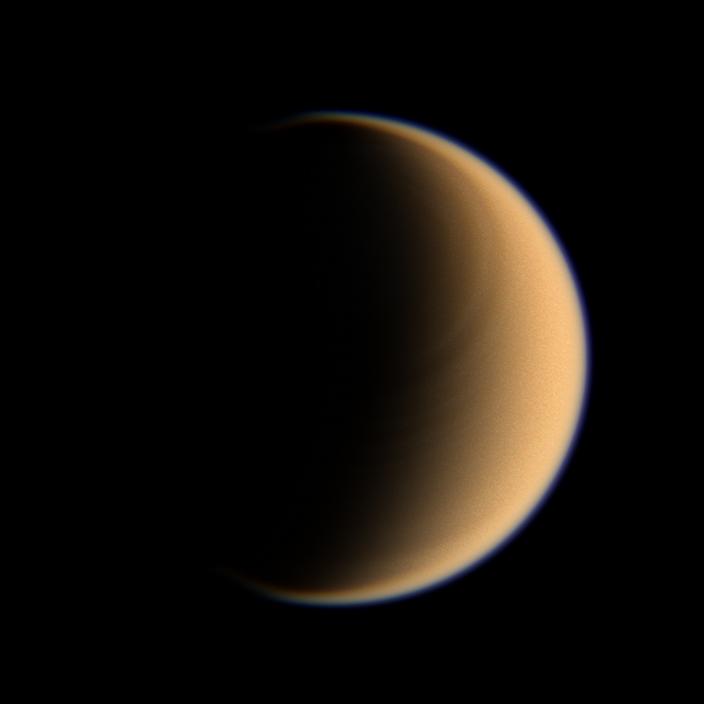 |
This natural color view of the Orange Moon was
generated by combining images taken using red, green and blue spectral
filters. The three views were acquired by the Cassini orbiter wide-angle
camera on January 28, 2007 at a distance of approximately 196,000 kilometers
( 122,000 miles ) from Titan. Image source: NASA, JPL |
 |
This radar mosaic is composed of two images captured by the Cassini radar mapper on two flybys. The lower part of the swath was obtained during the flyby of October 26, 2005, while the upper part of the image was acquired during the flyby of January 13, 2007. Both images were taken in synthetic aperture mode. The area is about 570 kilometers ( 354 miles ) wide and 390 kilometers ( 240 kilometers ) high. North is toward the top. The dark circular feature on the lower left of the image, called Ganesa Macula, is interpreted as a cryovolcano or ice volcano. A bright patch in the middle of Ganesa Macula can be spotted. It has connections with bright lines or streaks that "feed" the terrain surrounding the cryovolcano. The volcanic fluid or cryolava seems to run mostly eastward since the bright material is much more concentrated in the east part of the assumed volcano. It is likely closely linked to dominating winds which blow from the west to the east. Bright rounded landscape features, also interpreted as cryovolcanic flows, are observed towards the top and the right of the mosaic. Image source: NASA, JPL |
 |
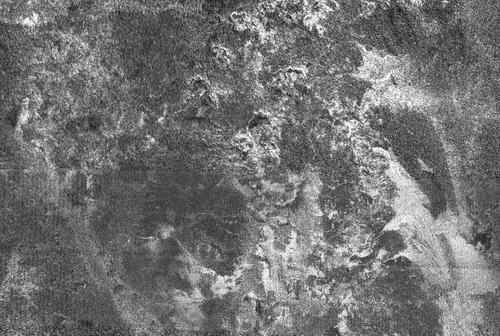
This radar image was acquired by Cassini's radar mapper during the Titan flyby of January 13, 2007. It was taken in synthetic aperture mode. The image is around 240 kilometers ( 150 miles ) wide by 140 kilometers ( 90 miles ) high and it is centered at about 26.5 degrees north and 9 degrees west. North is toward the top left corner of the strip. A semi-circular dark patch can be spotted. It appears to be a part of an impact crater, roughly 180 kilometers ( 110 miles ) wide. Very few impact craters have been identified on Titan which means that the surface is relatively young. Cryovolcanoes or rainfall must play a key role in resurfacing Titan's landscape. The bright material surrounding the round feature seems to be the crater's ejecta blanket. It is probably topographically higher than the surrounding plains. Some scientists speculate it might be composed of a mixture of water ice and ammonia. The inner part of the crater is very dark meaning that it is made of smooth deposits( hydrocarbon deposits...). The possibility that it is composed of liquid methane or ethane is not ruled out. Image source: NASA, JPL |
 |
This composite infrared image of Titan's north pole was acquired by the Cassini's visual and infrared mapping spectrometer during the flyby of December 29, 2006. A giant circular cloud formation about half the size of the United States can be spotted. The mammoth cloud covers the north pole down to a latitude of 62 degrees north and at all observed longitudes. It was imaged at a distance of 90,000 kilometers ( 54,000 miles ). The image was color-coded, with blue, green and red at 2 microns, 2.7 microns, and 5 microns, respectively. The goal was to observe the limb of the moon. The atmospheric circulation models of Titan predicted the cloud cover in the north pole. The cloud is probably closely linked to the lakes observed in the north polar region by the Cassini's radar instrument. Is it the result of evaporating methane or ethane lakes? Is it raining methane or ethane? Are there flashes of lightning and thunderstorms? Image source: NASA, JPL |
 |
This radar image was captured by the Cassini's
radar mapper in synthetic aperture mode during the Titan flyby of January
13, 2007. The image is approximately 160 kilometers ( 100 miles ) long
by 150
kilometers
( 90 miles ) wide. North is toward the top left corner of the image. Image source: NASA, JPL |
 |
This incomplete infrared map of Titan consists
of images taken using a filter centered at 938 nanometers. It was produced
using data acquired
by the Cassini spacecraft Imaging Science Subsystem ( ISS ). The darker
the area on this map, the less reflective it is. The brighter the area,
the more reflective it is. Any lake or sea is expected to have a low
albedo and to appear dark on this map. No topographic shading is visible
in these images because light is scattered by Titan's dense atmosphere.
The map is an equidistant projection which preserves distances on the
globe, with some distorsion of area and direction. The resolution is
low in some areas like Adiri, Belet, Senkyo or towards the north polar
regions while it is relatively high in the regions of Shangri-La, Xanadu,
Fensal and Aztlan. The worst coverage is on the trailing hemisphere
centered around 270 degrees west longitude. Image source: NASA, JPL |
 |
This radar strip was taken on July 22, 2006 by Cassini's radar instrument in synthetic aperture mode. The swath starts at the left ( 20 degrees north by 142 degrees west ). It follows a path toward the north and ends at 13 degrees north by 347 degrees west. One can clearly observe lakes north of 70 degrees latitude around the north pole.At the far left, a dark circular feature about 75 kilometers ( 47 miles ) in diameter, surrounded by a bright material, appears. It's probably an impact crater but the hypothesis of a volcanic caldera can't be ruled out. Up to 70 degrees north, the contrast between dark and bright areas is not pronounced. Other less distinct round shapes can be spotted. Some irregular features which seem to have been carved by a liquid can be identified. They may be dried lakes. By continuing to the right, one encounters a contrasted terrain with bright patches and dark meandering channels or valleys. It's likely that the bright patches are mountains, hills or plateaus. At around 70 degrees north, the dark lakes begin to appear. The lakes seem to be deeper close to the pole because they are darker. Some lakes are connected to dark channels, likely drainage channels. Some lakes have clear rims and other lakes have broad rims which tends to indicate that they are not completely filled with the liquid or that they are drying up. The enigmatic liquid is probably methane or ethane. But there is a slight chance that the lakes are filled with nitrogen. We leave the north pole and continue our journey toward the south. Apparently, some dry lakes start to appear. Irregular and complex terrain with mountains, hills or canyons begins to dominate. At the extreme right end, the famous cat scratches appear. The dark grooves are straight, drawn by the wind which blows from the west to the east. Image source: NASA, JPL |
 |
Both images showing the same area were captured by the Cassini spacecraft radar mapper on two different Titan flybys on December 11, 2006 ( T21 left ) and October 29, 2005 ( T8 right ). The images were taken in synthetic aperture mode. North is toward the top of both images. Each radar view is approximately 400 kilometers ( 250 miles ) long by 275 kilometers ( 170 miles ) wide. The images reveal a field of dunes located near 9.4 degrees south latitude by 290 degrees west longitude. Apparently, the dunes are engendered by a wind blowing in an eastward direction. The bright circular feature on the right part of the image seems to be an elevated terrain since it deflects the direction of the dunes toward the north. In other words, it acts as an obstacle. What kind of obstacle? Probably a mountain, hills or cliffs. The radar images have a different appearance because the radar instrument illuminated the dunes from different directions. Imagine that the radar signal comes from the left in the left image and from the top in the right image. The dunes are more clearly defined in the right image as their faces are caught by the illumination. It is surprising to observe a systematic contrast between the dunes in both views. As a result, it is tempting to say that the materials making up the dark and light stripes are likely different. The way the dunes reflect radar waves gives us clues about the nature of their compounds. Image source: NASA, JPL |
 |
This modified radar image, tinted in false colours is based on the radar image in synthetic aperture mode taken during the Titan flyby of July 22, 2006. The strip of radar imagery is foreshortened to simulate an oblique view of the highest latitude region, seen from a point to its west. The image is centered near 80 degrees north, 35 degrees west and is around 140 kilometers ( 84 miles ) across. This image was published in the journal Nature on January 4, 2007 and appeared on the journal's cover. It reveals striking clues that the region is filled with large bodies of liquid, probably liquid methane or liquid ethane. Intensity in this colorized view is proportional to how much radar brightness is returned , or more specifically , the logarithm of the radar backscatter cross-section. The lakes, darker than the surrounding terrain, are emphasized here by tinting regions of low backscatter in blue. Radar-brighter regions are shown in tan. Image Source: NASA, JPL, Nature |