Titan Radar Analyses 2012
|
|
|
|
|
|
|
|
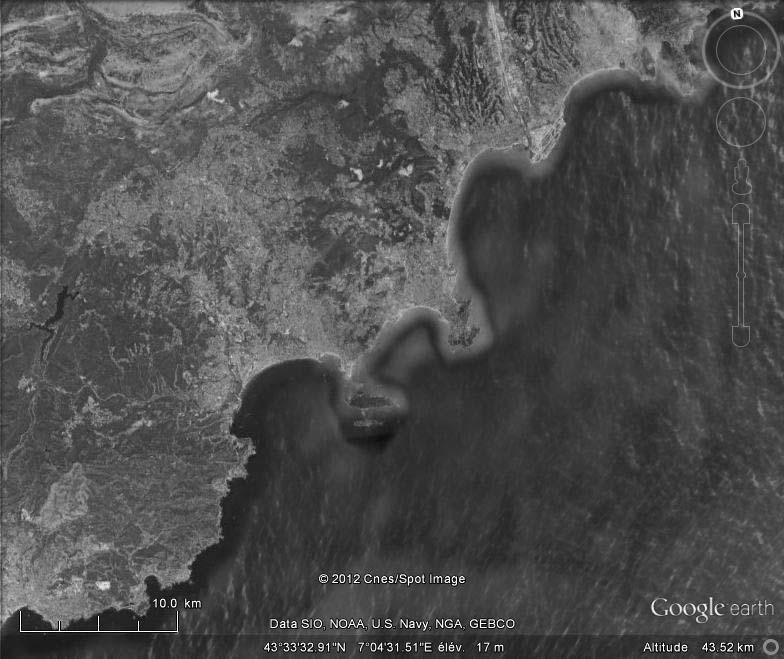
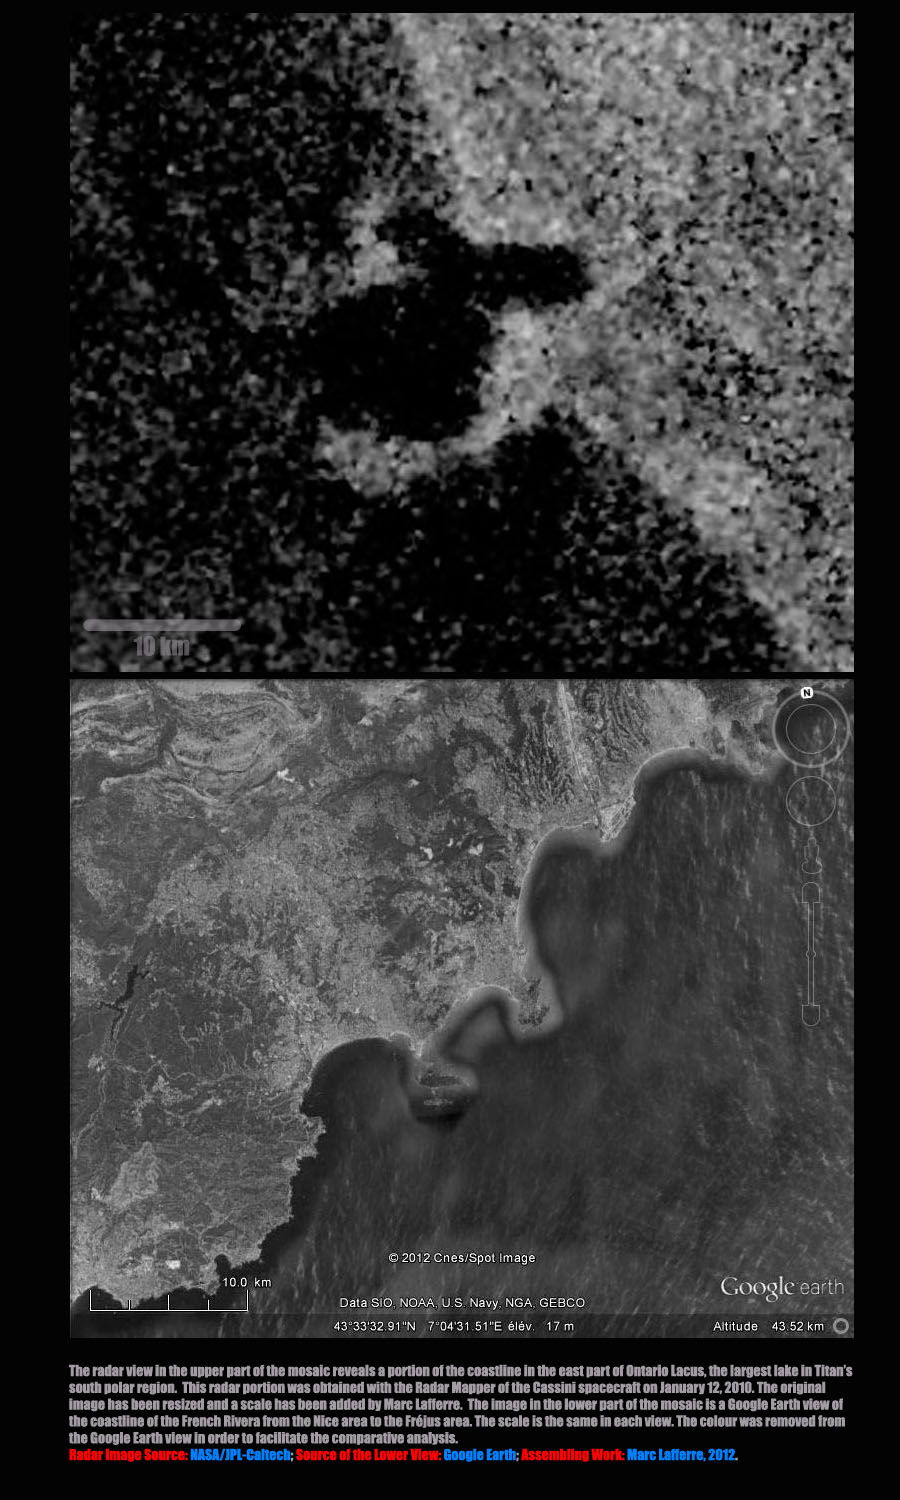
| The table above confronts an intriguing portion of the
coastline of Ontario Lacus, the largest lake of Titan's south polar
region and a portion of the coastline in the south-east of France from
the Nice area to the Fréjus area. The upper view of the table
corresponds to a radar image of Ontario Lacus taken from the Radar
Mapper of the Cassini spacecraft on January 12, 2010. A transparent
rectangle was incorporated into the original radar view to unveil the
topographic area of the study. The second image, from the upper part of the table, corresponds to the zoom or the enlargement of the area of the study. This portion shows a series of bays in the eastern part of the dark Ontario Lacus. The third view corresponds to a Google Earth image of the French Riviera from the Nice area to the Fréjus area. The colour was removed from the original Google Earth view and the image is at the same scale as the second view focusing on the eastern bays. The mosaic in the lower part of the table allows us to perform a comparative analysis of the irregular shoreline of the French Riviera and of the enigmatic bays which mark a rupture in the relatively linear and progressive coastline of the eastern part of the Ontario Lacus depression. A scale was incorporated into the original radar view to facilitate the comparative analysis. The French Riviera area and the Ontario Lacus area are at the same scale as well. The lake seems deeper in the bay area of Ontario Lacus than in the rest of the southern part of the lake. How to interpret ? Is it the remnant of a meteoritic impact which engendered a distortion in the topography of the eastern coastline ? Does it hide a cryovolcano or an internal source which feeds the lake with hydrocarbons such as ethane, methane and propane ? Or is it the outcome of a topographic depression which attracted a high amount of liquids which has a distortion effect or erosive effect on the coastline ? The debate is open.
Source of the upper part image:
NASA/JPL-Caltech. |


|
|
|
|
|
|
|
|
|
|
|
|
|
|
|
|
|
|
|
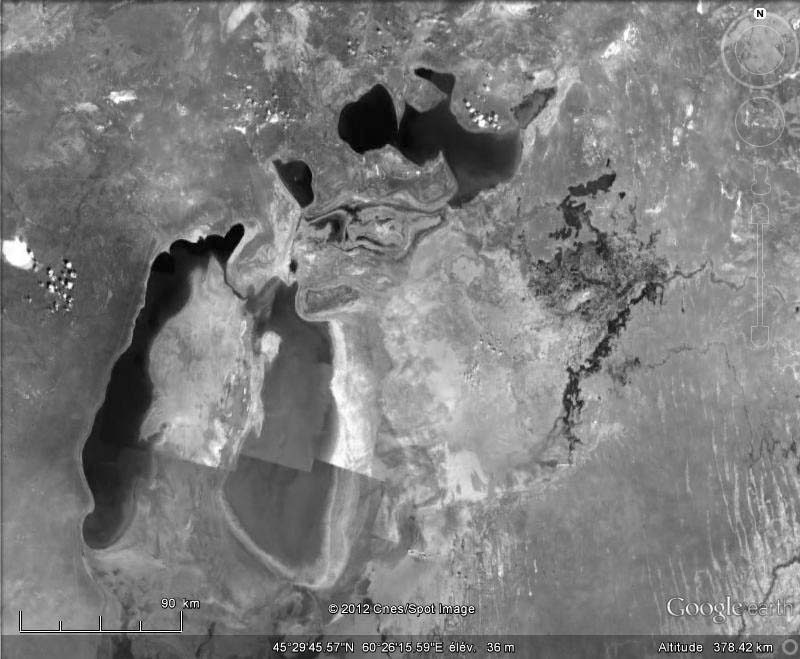
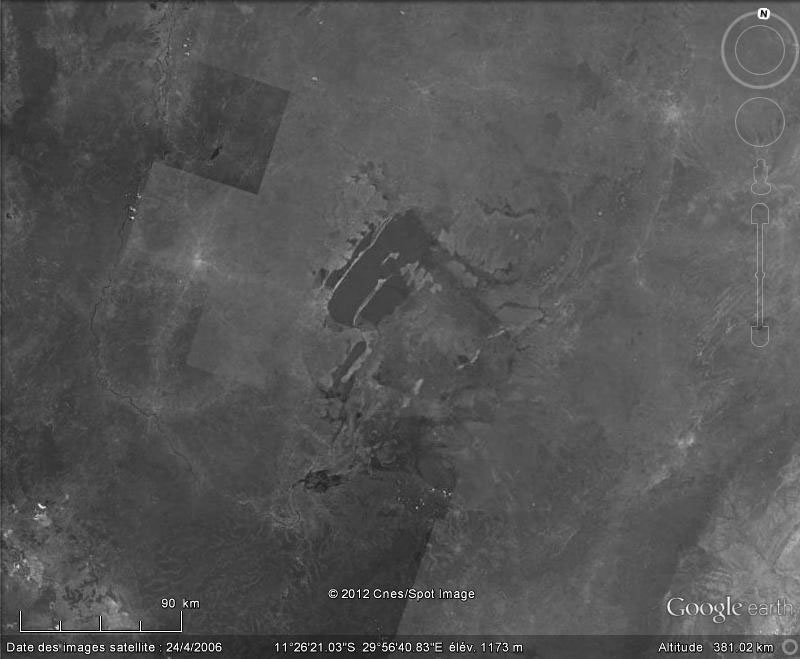
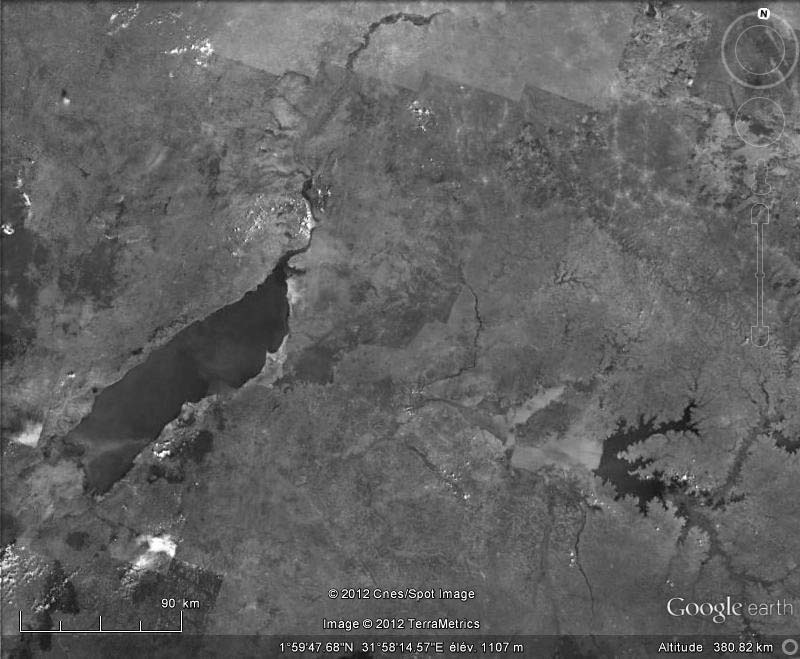
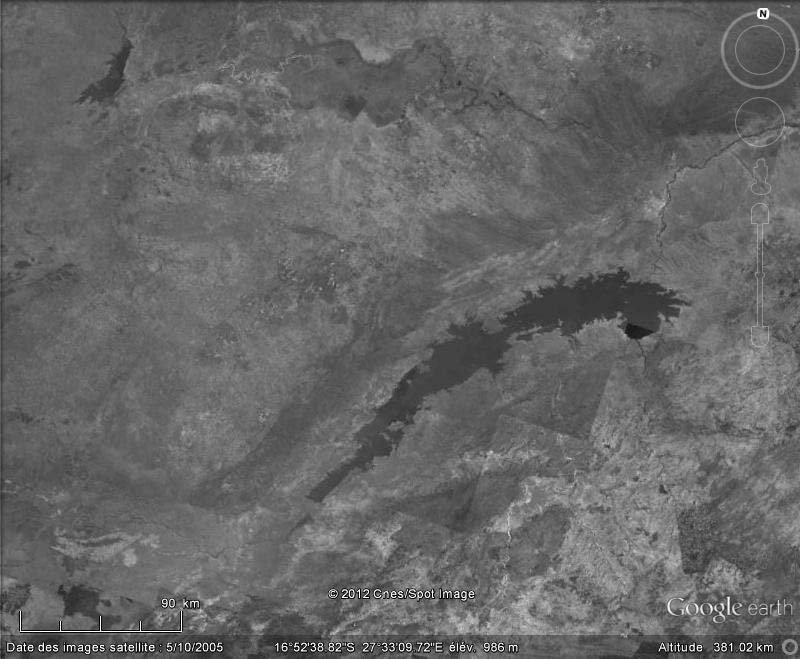
The series of images above allows
us to perform a comparative analysis of Ontario Lacus, the largest lake
of Titan's south polar region and some selected Terrestrial lakes. The
upper view of the table corresponds to a radar image of Ontario Lacus
obtained on January 12, 2010 with the Radar Mapper of the Cassini
spacecraft. The second view from the top of the table
is a Google Earth image revealing the Aral Sea between Kazakhstan and
Uzbekistan. The third image from the top of the table is a Google Earth
view showing the Bangweulu Lake in Zambia. The fourth image from the top
of the table is a Google Earth image unveiling Lake Albert between
Uganda and the Democratic Republic of the Congo. The fifth view from the
top of the table is a Google Earth image showing the Kariba Lake between
Zambia and Zimbabwe. The sixth image from the top of the table is a
Google Earth view showing the Cahora Bassa Lake in Mozambique. The
seventh view from the top of the table is a Google Earth image revealing
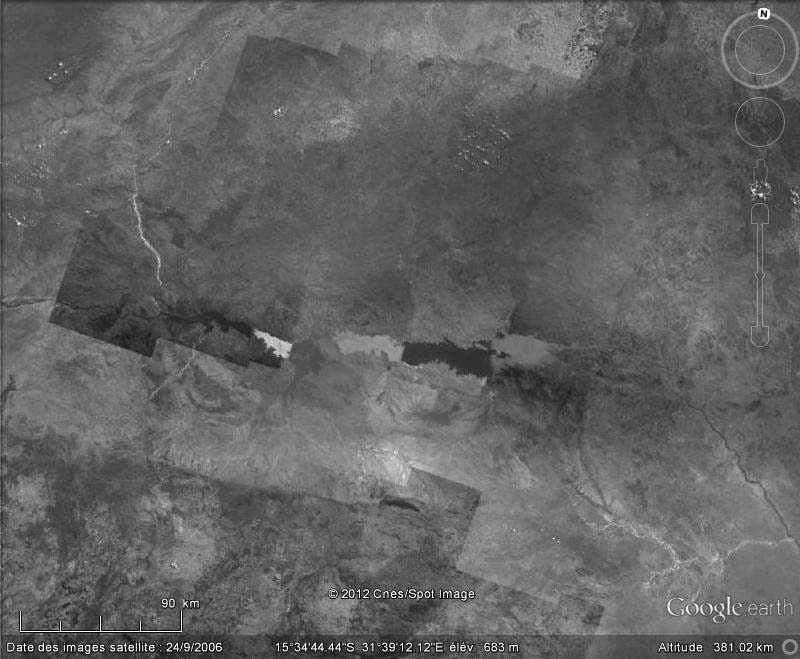
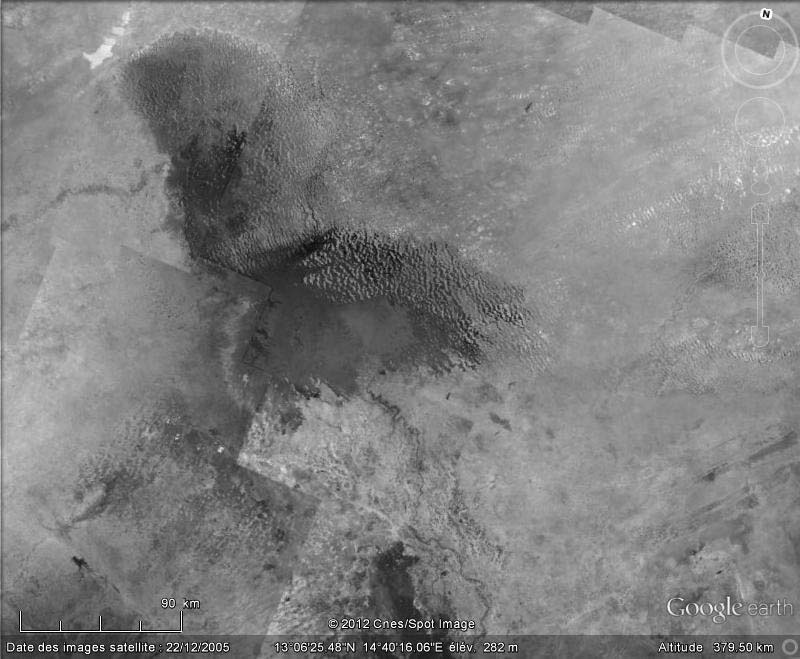
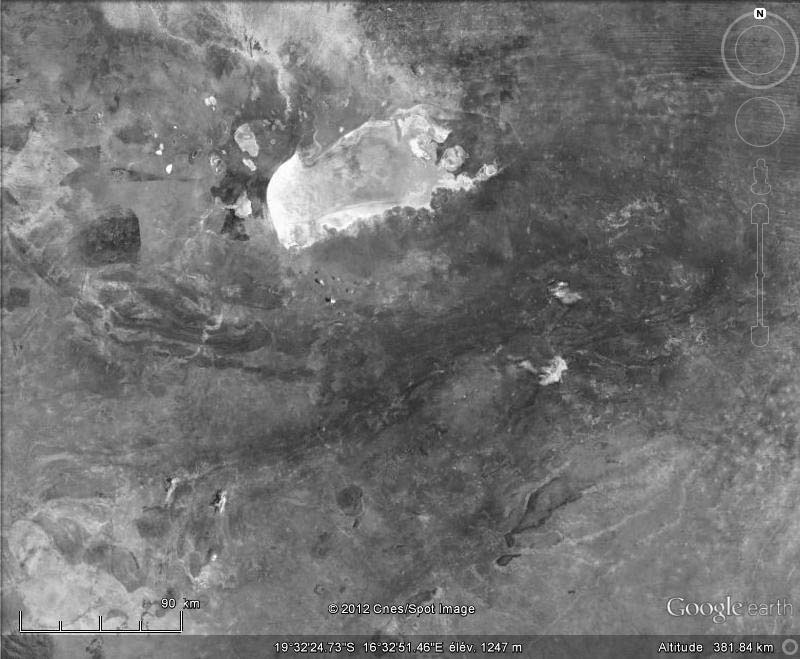
Lake Chad between Nigeria and Chad. The eighth image from the top of the
table is a Google Earth view showing the Etosha Pan located in the north
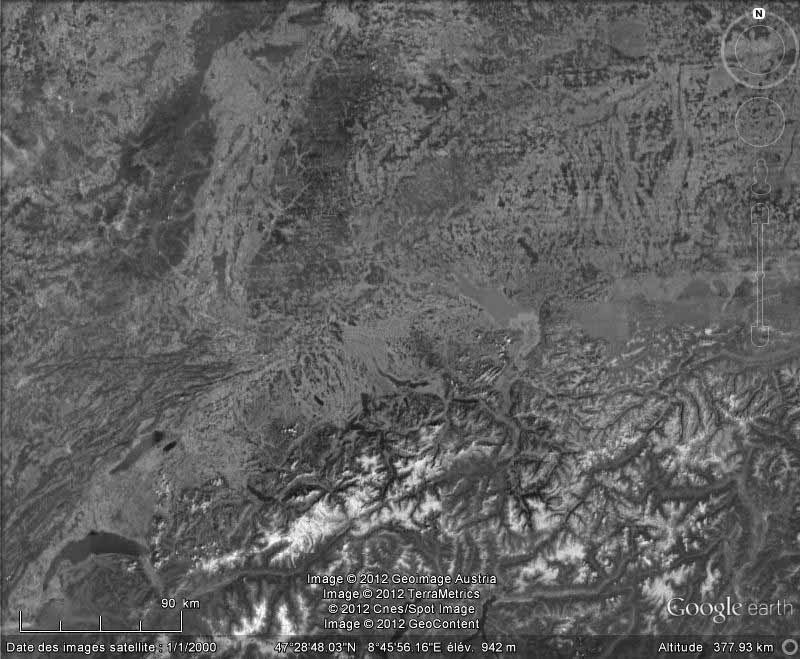
of Namibia. The ninth image from the top of the table is a Google Earth
view showing Lake Constance or Bodensee found between Germany,
Austria and Switzerland. Post Scriptum: The colour has been
removed from each Google Earth view and the scale is the same in each
view in order to facilitate the comparative analysis. |